Summary:
- More than 34,000 route diversions have been recorded in the four weeks since the Strait of Hormuz disruption, with no sign of normalization. Week 4 produced the highest total of the period, confirming that rerouting activity remains elevated rather than reverting toward pre-closure levels.
- Navi Mumbai has emerged as the most pressured port, with import dwell more than doubling from under 12 days at closure to 23.47 days by Week 4, the highest level observed across the region. This surge is being driven by transshipment, which has increased more than 700% versus February baselines, transforming Navi Mumbai from a minor node into a major regional hub in just four weeks, contributing to mounting congestion.
- Outside of Navi Mumbai, congestion continues to worsen one month in, with import dwell rising across all monitored hubs, including India, Singapore, and China, showing no sign of stabilization despite carriers completing initial rerouting adjustments.
- UAE share of diverted cargo fell from 42.6% in Week 1 to 33.1% in Week 4, while Saudi Arabia climbed rapidly from 4% to 15%, overtaking India and Oman to become the second‑largest diversion destination.
Overview
One month into the Strait of Hormuz disruption, emergency rerouting has given way to structural change across container shipping networks. Four weeks of post-closure data now paint a consistent picture: diversions remain elevated, congestion is deepening at India’s western gateways, and carriers are actively rebuilding their routing structures rather than reverting to pre-closure patterns.
Cargo is no longer being diverted temporarily. It is being redistributed into new routing structures across the Indian Ocean and Asia.
Across four weeks, total route diversions reached 34,294. While volumes remain persistently high, the geographic distribution of those diversions has continued to evolve. The UAE remains the largest receiving country, but its share declined steadily from 42.6% in Week 1 to 33.1% in Week 4. The most pronounced changes emerged in the latest week, with Saudi Arabia rising to become the secondlargest destination at 15.0%, Singapore jumping from nearnegligible levels to 6.7%, and Sri Lanka’s role declining sharply from 12.5% in Week 2 to just 1.0% in Week 4.
At the ports absorbing rerouted cargo, congestion is not stabilizing. Dwell times continue to climb, with Singapore’s transshipment congestion reaching its highest recorded level during the disruption. Together, these trends indicate that carrier adjustments now reflect longer-term network reconfiguration rather than short-term diversion tactics.
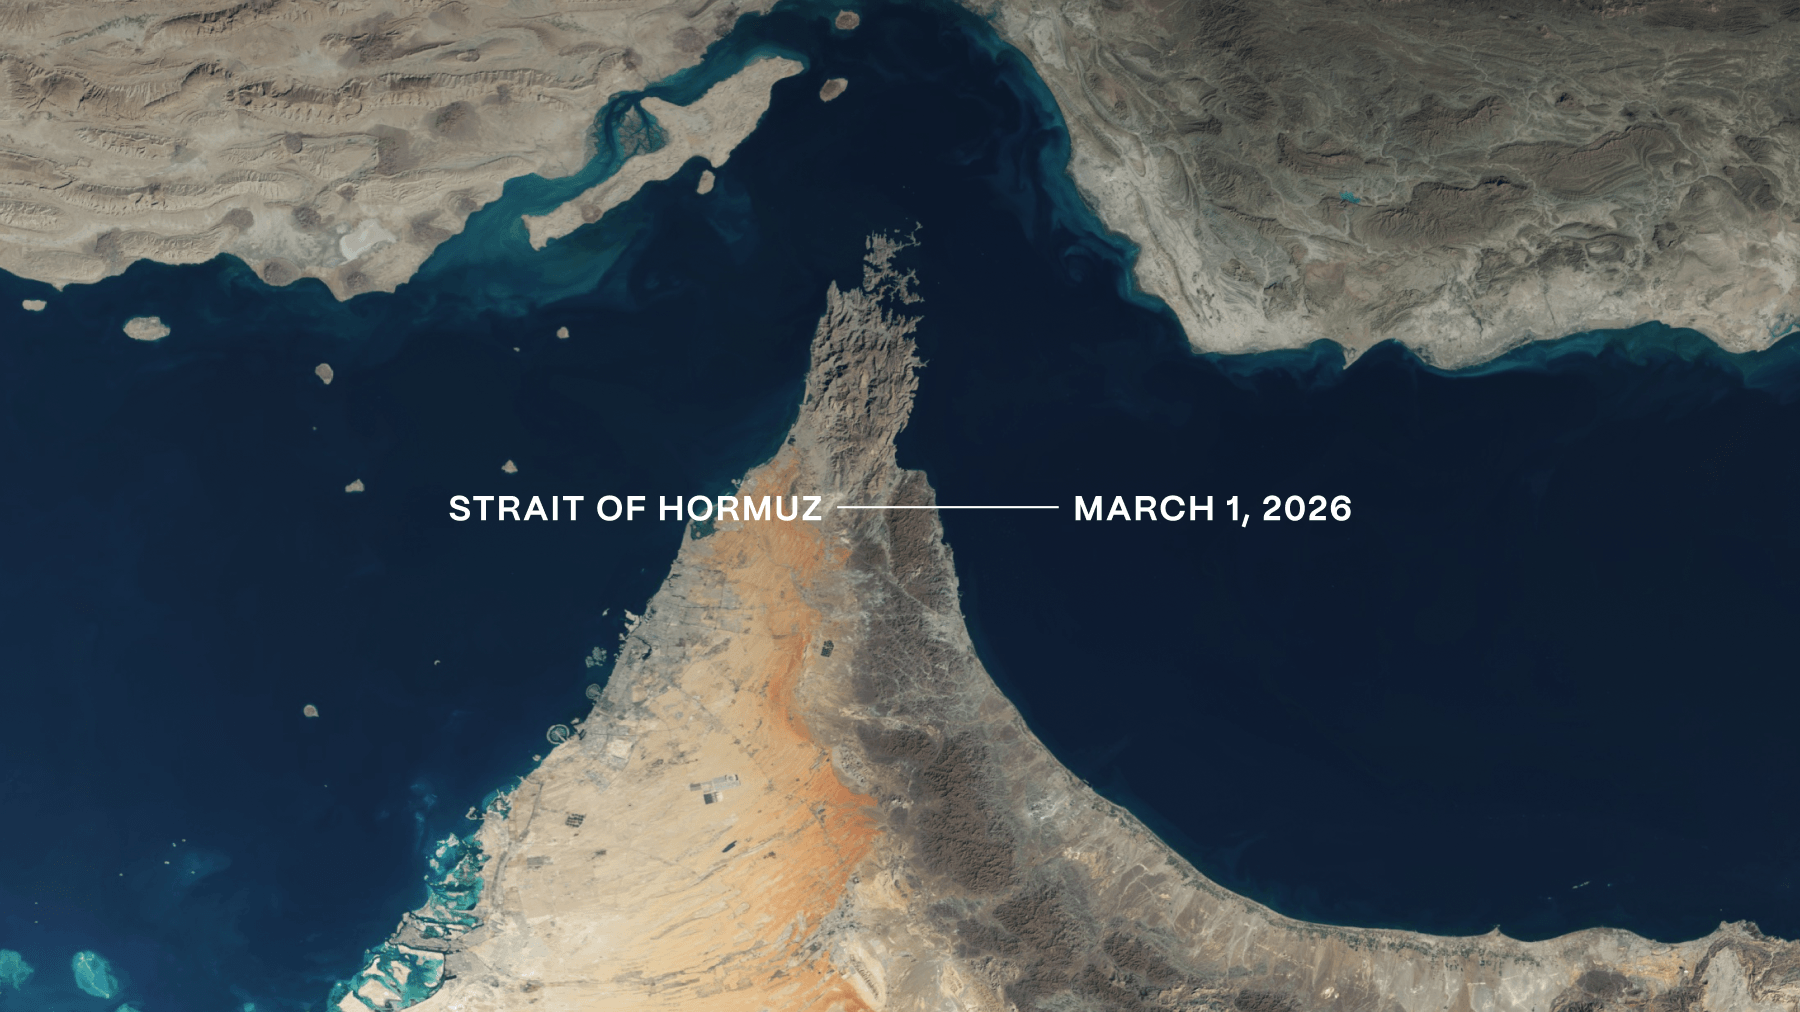
Diversions around the Strait of Hormuz continue to be elevated
Four weeks after the closure, route diversion volumes remain well above predisruption levels. The chart below illustrates the full diversion trend from February 20 through March 29, highlighting the sustained elevation in rerouting activity as carriers continue to operate outside preclosure network patterns.
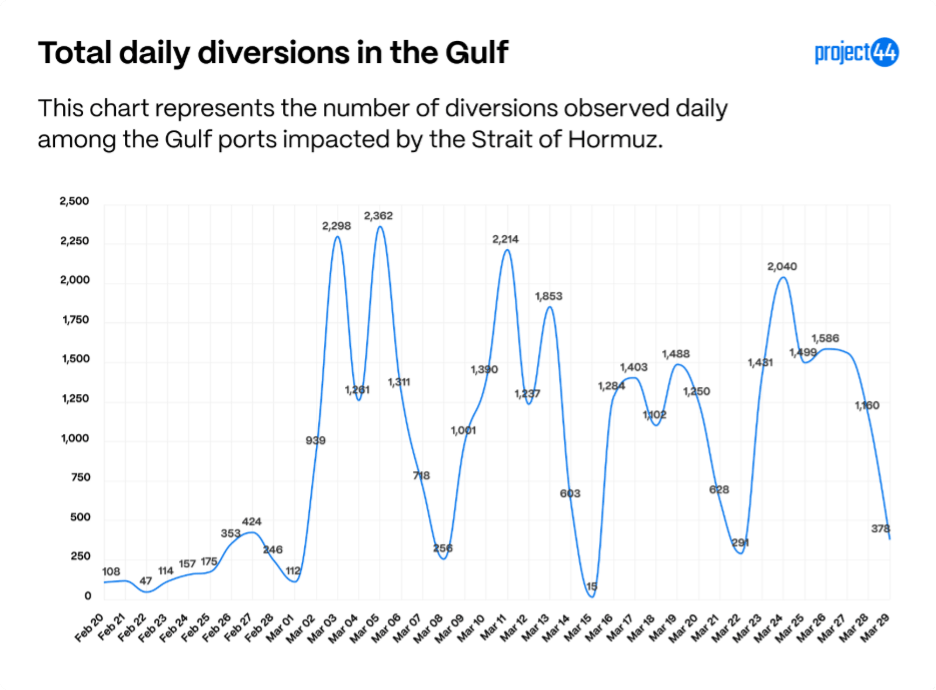
Weeks 1 and 2 recorded the highest singleday peaks, driven by sharp surges on March 3, 5, and 11. While overall diversion volumes eased in Week 3, Week 4 rebounded to produce the highest weekly total of the period. Unlike earlier weeks, that increase was driven by sustained midweek elevation rather than isolated daily spikes. This shift indicates carriers are increasingly operating within revised routing structures, rather than relying on shortterm, adhoc diversions.
Import dwell continues to rise at key ports
Across the four key ports monitored, Navi Mumbai, Mundra, Singapore, and Shanghai, the same structural pattern persists one month into the disruption. Import dwell is rising consistently across all four ports as rerouted cargo continues to accumulate and network adjustments remain incomplete.
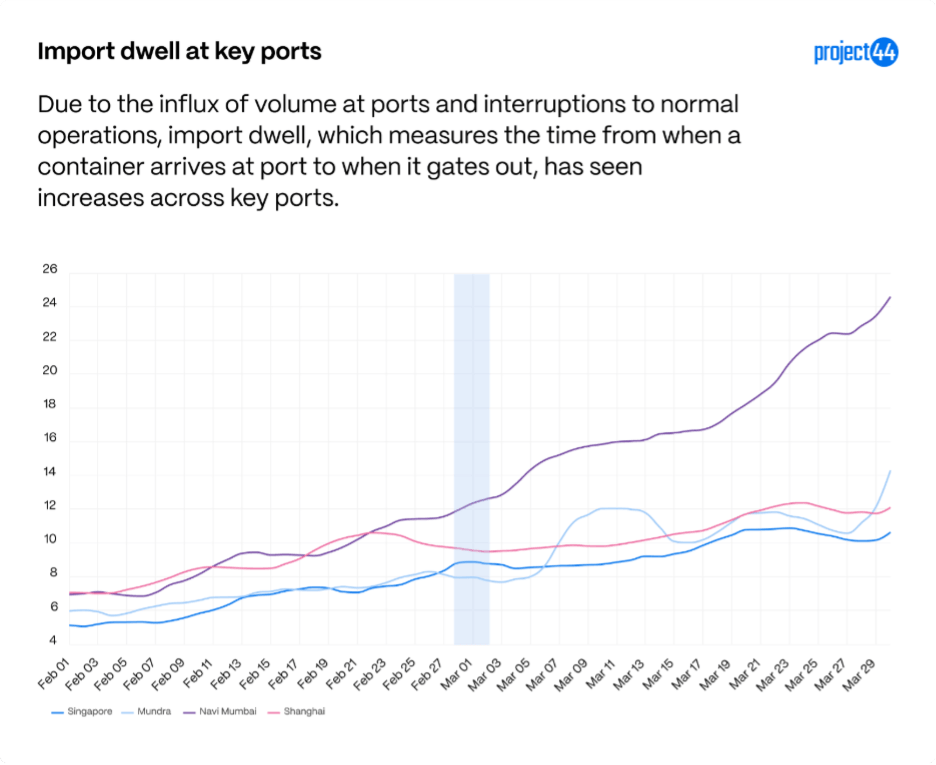
Navi Mumbai is the most severely impacted. Import dwell has increased from under 12 days at the time of closure to 23.47 days by Week 4, the highest level observed among the ports in this analysis and still rising with no indication of an approaching peak.
Mundra displays a different trajectory. Import dwell has also trended higher, rising from 8.1 days pre closure to 14.3 days currently. However, it experienced a brief period of stabilization in mid-March before re accelerating, suggesting temporary operational relief rather than a sustained easing of congestion.
Outside India, import dwell pressures are also building. At Singapore, inbound dwell has risen sharply relative to its pre–Lunar New Year seasonal baseline as transshipment volumes intensify. Shanghai shows a steadier but persistent increase, with import dwell reaching 12.1 days, representing a 76 percent rise versus its pre–Lunar New Year baseline. Together, these trends indicate that congestion tied to the Strait of Hormuz disruption is propagating beyond the immediate region and into broader Asian port networks.
Transshipment volumes in Mumbai surge
The transformation of Navi Mumbai’s transshipment function is the story of the first month of disruption. The chart below shows the transshipment volume escalating dramatically and quickly.
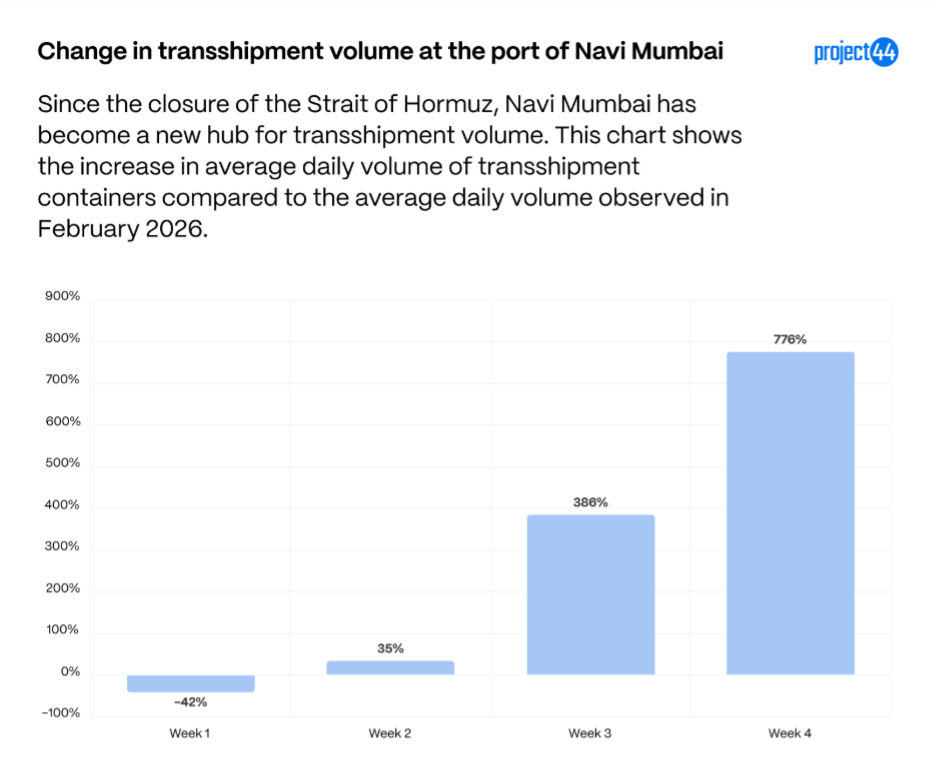
Based on the average daily shipment volumes observed in February 2026, transshipment container volumes have surged by more than 700% over the four weeks following the Strait of Hormuz disruption. Navi Mumbai was not previously a significant node in global transshipment networks, but that role has expanded rapidly over a relatively short period as carriers restructured routes and reassigned intermediate port calls.
This sharp increase in transshipment activity appears to be a key factor behind the disproportionate rise in import dwell observed at Navi Mumbai relative to other ports experiencing diversions. The operational complexity associated with handling transshipment flows, combined with the overall volume increase, is placing added strain on port operations. As a result, congestion at Navi Mumbai has intensified more quickly and persisted longer than at other monitored ports, reinforcing its role as a pressure point within the adjusted regional network.
The geographic distribution of diversions continues to shift
Four developments stand out across the four-week arc as carriers continue to redistribute diverted cargo across the region. While the UAE remains the top destination for diverted cargo across all four weeks, the composition of that traffic and the position of other destinations have changed substantially.
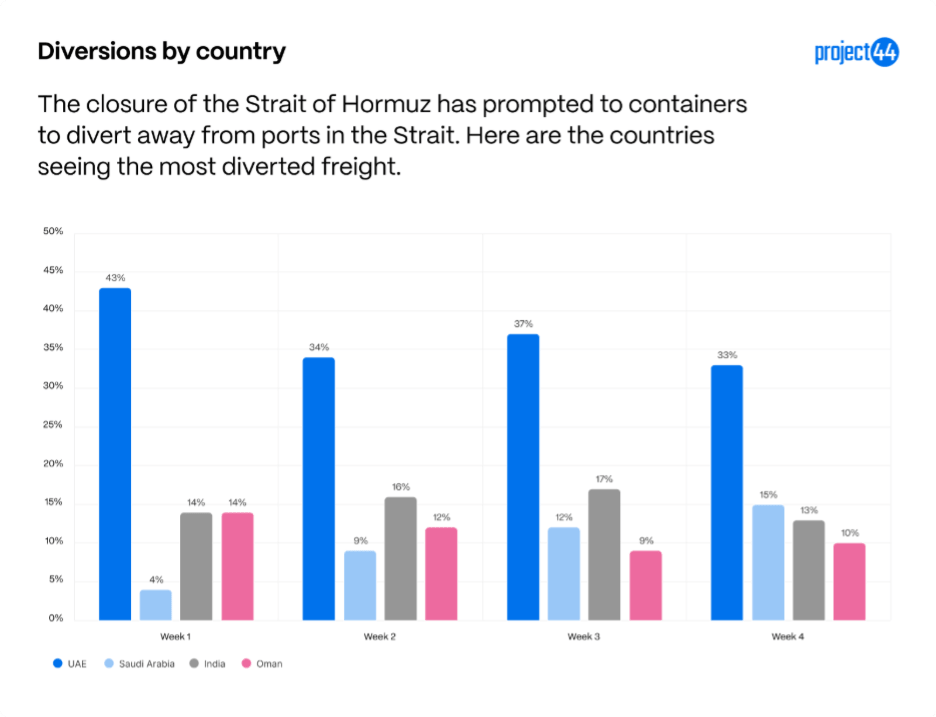
Saudi Arabia has emerged as the fastest rising destination within this group, climbing from 4% of all diversions in Week 1 to 15.0% in Week 4, overtaking both India and Oman to become the second-largest destination behind the UAE. Jeddah and other Red Sea adjacent Saudi ports are increasingly absorbing cargo that previously moved through Gulf hubs, reflecting a shift toward routings that remain regionally proximate while minimizing exposure to the Strait.
The UAE remains the single largest recipient of diverted cargo, though its share has steadily declined over the four-week period. This contraction suggests that congestion and capacity constraints at UAE ports are prompting carriers to distribute traffic more broadly rather than rely on a single regional fallback.
India’s role has remained comparatively stable over the period, continuing to function as a key alternative gateway for rerouted cargo. However, mounting pressure at India’s western ports indicates that while volumes are holding, congestion dynamics are becoming a more significant constraint on how much capacity can be absorbed without further network adjustment.
Oman has seen a relative decline in share as carriers push traffic either farther west toward Saudi Arabia or continue to rely on established Gulf hubs within the UAE. This shift indicates that ports adjacent to the Strait are playing a diminishing role as carriers prioritize routings that create greater geographic separation from the disruption.