Cargo theft has reached an inflection point. Losses across U.S. and Canadian freight networks now exceed $35 billion annually (CargoNet 2024), with incidents surging 57% year-over-year, and average losses routinely exceeding $580K. What has changed most is the nature of the threat: physical hijackings have given way to digital fraud, spoofed carrier identities, and mid-route transfers that exploit gaps in carrier vetting.
The market is responding, risk mitigation software spend is up ~18% year-over-year in 2025, but blind spots persist. False identities, mid-route handoffs, and sanctioned-lane violations continue to slip through even well-vetted networks. project44 is uniquely positioned to close these gaps by connecting location and compliance signals into a real-time risk intelligence layer, enabling shippers to detect, prevent, and respond to threats the moment they emerge.
The earliest and most reliable signal of a threat in motion is a truck that stops behaving as expected— it drifts off the planned corridor, lingers abnormally, or oscillates without making forward progress and that’s exactly what route deviation detection is designed to catch.
What is route deviation and why it matters for fraud prevention
A route deviation occurs when a shipment diverges from its expected lane or timeline between pickup and delivery. In practice, these signals correlate with fraud and theft patterns, missed milestones, and cascading ETA inaccuracies. By elevating deviations to first-class exceptions, shippers can trigger playbooks, such as contacting carriers, dispatching security, or rerouting assets, before losses materialize.
How do we detect anomalies?
At project44, we receive more than 3 million GPS pings per day for the shipments we track. Worldwide, we track more than 50,000 shipments per day, with the majority following expected pickup and drop-off appointment times and trajectories. Finding fraud patterns among these is akin to finding a needle in a haystack. In addition to the sheer scale, we do not know in advance what these fraud patterns look like, nor do we have access to a labeled dataset of confirmed good or bad shipments.
Given the lack of labeled data, unsupervised learning methods have become the natural choice for gaining insights and uncovering patterns. We chose the Isolation Forest algorithm, which identifies the most anomalous data points using an anomaly score. This algorithm runs in linear time complexity, making it fast for both model training and inference.
How the detection engine works
Every GPS ping a shipment generates is evaluated in real time against two models:
- Distance deviation: measuring how far the truck has strayed from the expected corridor
- Time deviation: Flags abnormal progress patterns while the truck is still on the corridor, for example, back-and-forth motion, regression toward the origin, or a lack of forward movement.
Each ping receives an anomaly score. Post-processing then consolidates these scores with domain rules (minimum consecutive anomalous pings, distance-to-lane thresholds, and speed/regression checks) to produce a shipment-level decision and raise an exception with explainability.
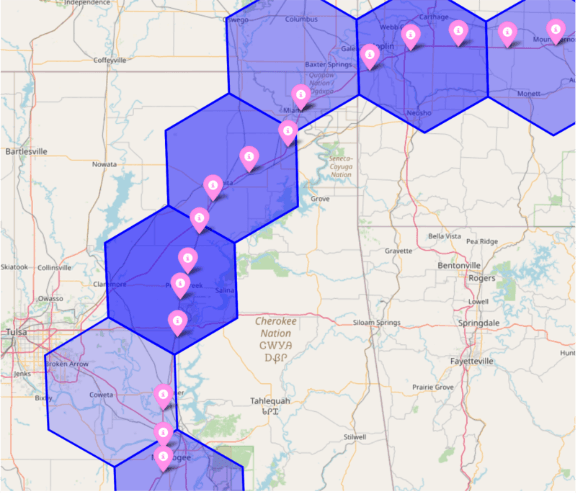
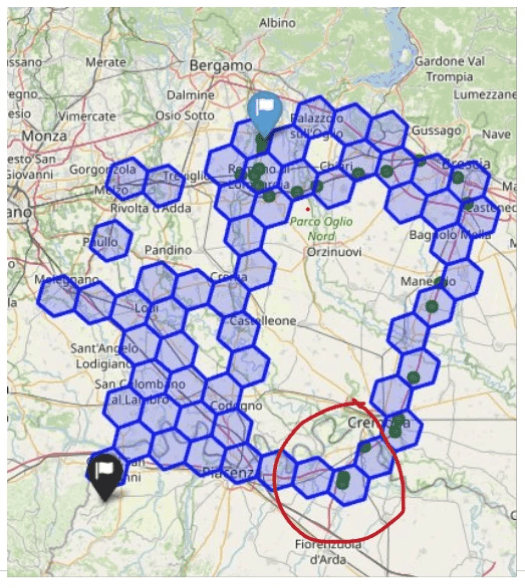
Building the map of normal: Reference lanes with hexcells
Expected routes are encoded as hexcell lanes, which divide a route into small geographic spatial tiles that, together, define what a normal path looks like for a given-origin destination pair. These lanes are built from historical shipment data and serve as the baseline the system measures every live ping against. Customers can also contribute their own shipment history to build tailored baselines specific to their freight network We have already mapped over 1 million lanes, providing a strong foundation for building and scaling these models.
Fraud signals the system watches for
Not all deviations look the same. The system flags three distinct patterns:
- Rapid lane divergence: an early sign of unauthorized detours or off-route activity
- Sustained dwell or oscillation on-lane: potential staging or pilferage that doesn’t break the corridor but stalls progress
- Failure to complete the trajectory: insufficient time or distance remaining to reach the destination, flagging non-delivery risk
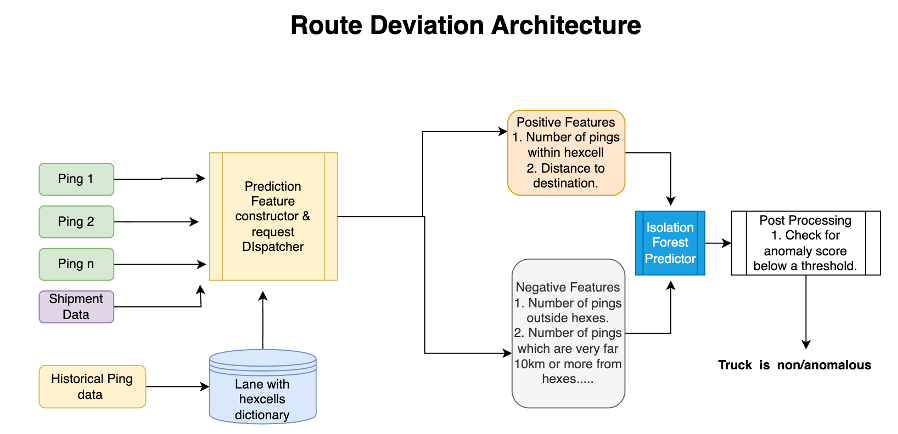
How it works end to end
Each GPS ping is streamed into the deviation service, where two Isolation Forest models score it independently for distance- and time-based anomalies. Those scores are filtered through calibrated thresholds and a consecutive-ping guardrail to suppress noise, and once a deviation is confirmed, an exception is published to the platform with the location, timestamp, type, and severity,ready for immediate action.
Under the hood: How the models are built and tuned
Dataset construction
We trained on over 100,000 shipments and 5 million pings across North America and Europe, none of it labeled. Without ground truth, we bootstrapped by applying initial threshold scores, visually inspecting flagged cases, and routing sampled deviations to an annotation team. Their feedback iteratively shaped our golden validation set and drove threshold refinement.
Feature engineering
For each GPS ping, the system evaluates a range of signals: how far the truck has strayed from its expected path, whether its speed or movement pattern looks abnormal, whether it’s making meaningful forward progress, and whether the timing aligns with what’s typical for that route. Two separate models handle distance and time signals independently, keeping each focused and precise.
Post-processing safeguards
The system is designed to raise alerts only when there’s a real cause for concern. An alert only fires after multiple consecutive suspicious pings, not just one, reducing the chance of flagging ordinary events like a rest stop or a minor detour. Thresholds are calibrated to the characteristics of each lane, so the bar for what counts as „anomalous“ reflects what’s normal for that specific route.
Evaluation
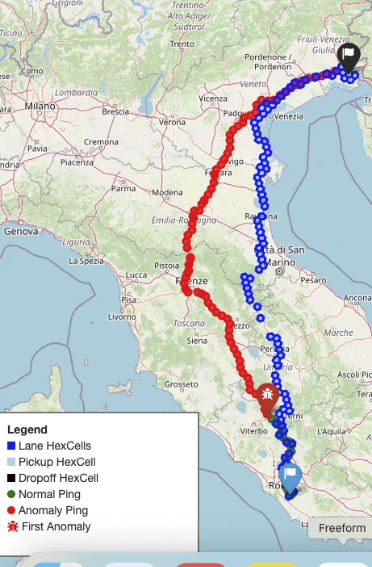
Without labeled ground truth, we built a custom evaluation framework grounded in observable outcomes. Two milestone-based rules anchor the approach: a truck that never registers a destination arrival is a clear deviation, and one that arrives significantly late after a triggered alert confirms the model caught a real delay or detour.
Most flagged cases, however, didn’t fit neatly into either bucket. To validate these, we built Folium-based map visualizations overlaying the baseline route, live pings, and model output, making it possible to inspect each case visually and build confidence in the system’s judgment.
The route deviation detection system is now live in production, processing millions of GPS pings daily through a scalable FastAPI/GKE pipeline and surfacing real-time fraud alerts and risky lane insights directly to customers.
From detection to action
We will integrate route deviation detection with AI-powered agentic workflows, where agents call the carrier or customer with this information and determine the next course of action. Exceptions are raised on the platform at the shipment level, and the location and timestamp of the deviation are highlighted in the UI so that future incidents can be prevented. Fraud attempts often manipulate the route before any milestone fails. By continuously scoring live telemetry against trusted lanes and progress norms, the system exposes deviations at their onset, enabling immediate escalation. The result is fewer losses, faster recovery when incidents occur, and measurable improvement in delivery reliability.
Conclusion and next steps
With this work, we have implemented the first fraud detection system at project44 and are now rolling out this feature across multiple customers. Carriers can contact truck drivers to take the necessary actions. Future work includes processing real-time news feeds to further identify risky zones and enable preemptive actions. As fraud scales, the current manual evaluation of deviations will become insufficient, calling for an automated pipeline. At present, visualizations are inspected manually, a process that is time-consuming to verify. We are training an agentic LLM-based approach for automatic label generation and explanation of deviations. We’ll be sharing a dedicated technical deep dive on that work soon.