Summary:
- Blank sailings normalized after tariff disruption: Blank sailings peaked in April 2025 at 131 total sailings, led by Aisia-U.S. (39), China-U.S. (33), and U.S._China (30), before falling to just 11 total blank sailings in January 2026, the lowest level in over a year.
- U.S. imports from China continue to decline: Imports from China dropped 29% in 2025 vs. 2024, with the slowdown accelerating in January 2026 (-35% vs. January 2025), despite the typical Lunar New Year inventory build period.
- U.S. exports to China remain under pressure: U.S. exports to China fell 37% in 2025 vs. 2024, briefly rebounded with a 14% increase in December 2025, but declined again in January 2026 (-20% vs. 2025), signaling continued trade strain.
- Sourcing shifts toward Southeast Asia: In 2025, U.S. imports increased 30% from Thailand and 34% from Indonesia year-over-year; momentum strengthened in January 2026, with Thailand up 14% and Indonesia up 35%, reinforcing Indonesia’s role as a key alternative supplier.
Overview
The tariff landscape in 2025 has been shaped by the sweeping overhaul introduced on April 2, known by the current administration as “Liberation Day.” The United States imposed a flat 10% tariff on nearly all imported goods while raising duties on strategic sectors such as steel, aluminum, autos and auto parts under Section 232. Some auto related categories now face tariffs of 25%, and the use of the International Emergency Economic Powers Act broadened coverage even further with certain products carrying total tariff burdens above 40%. These changes triggered immediate supply chain disruptions, increasing costs and prompting companies to reassess sourcing strategies, pricing and inventory management.
Despite signs of stabilization, uncertainty persists. A major Supreme Court case will determine whether the administration’s expansive use of tariff authority is constitutional, and several large importers have filed lawsuits seeking refunds for duties they contend were improperly applied. Diplomatic negotiations have provided selective relief for allies, yet the flat 10% tariff and additional sector-based surcharges largely remain intact. With policy outcomes still unresolved, shipping patterns may continue normalizing for now, but the broader legal and regulatory landscape leaves the door open for renewed volatility.
Blank sailings data shows normalization in sailing schedules
In 2025, blank sailings data illustrates how carriers are responding to tariff-driven disruption in US trade. The chart below outlines the total number of blank sailings per month on major U.S. trade lanes (Asia-U.S., China-U.S., Europe-U.S.) that have been most impacted by the tariffs.
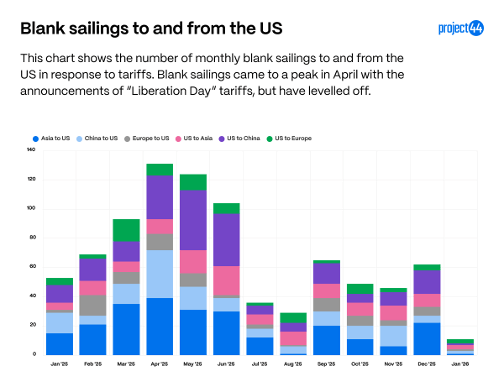
April 2025 marks the peak in blank sailings at a total of 131 blank sailings across these 6 routes. The lanes with the most blank sailings that month were Asia to the U.S. at 39, China to the U.S. at 33, and the U.S. to China at 30. These three lanes have had the highest rates of blank sailings throughout the year.
January 2026 has seen the lowest amount of blank sailings along these lanes in over a year, hopefully signaling that the schedule interruptions throughout related to changes in tariffs and trade relationships has found a new normal and will remain stable barring major changes in trade policies. Only 11 total blank sailings took place along these major trade routes through January, with US to China and US to Europe having the most at 3.
US trends in trade partners shift
While tariffs on major trade partner China have been reduced in recent months, their effects continue to ripple through supply chains. A closer look at US/China trade flows in 2025 reveals sharp swings tied directly to tariff actions and market anticipation.
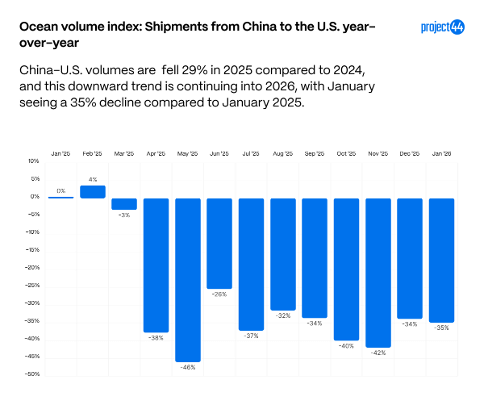
On the import side, shipments from China to the US fell 29% in 2025 compared to the volume in 2024. January 2026 shows that this decline is continuing for the foreseeable future with a 35% decline in volume compared to January 2025. This comes at a time where companies typically order surplus inventory in order to prepare for the Lunar New Year (Feb. 17th this year), where factories shutdown and delays in manufacturing and shipping occur. It is clear from the numbers that imports from China are slowing.
In response to the US tariffs, China passed their own tariffs on US goods, impacting exports from the US to China.
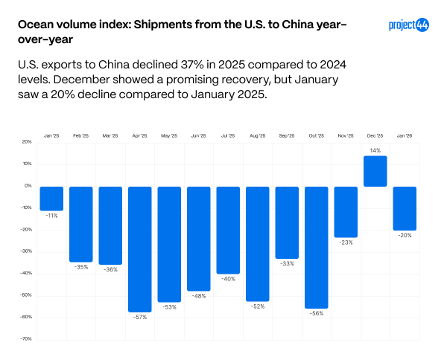
On the export side, shipments from the US to China are under even greater pressure, with exports to China dropping 37% in 2025 compared to 2024. Despite a low year for US imports into China, November showed the smallest decrease compared to 2024 since January, at just 23% lower than November 2024, and December had an increase of 14% compared to 2025 marking the first positive month for US exports to China in 2025. Trump and Xi did have a meeting at the end of October about a tentative trade deal, which appears to have helped stimulate US exports, though meaningful differences in US imports from China from this discussion have yet to be observed. While this is promising, January 2026 did see a 20% decline compared to 2025, showing that this trade relationship is still under pressure.
It is abundantly clear that the new tariffs passed by both countries have had major impacts on demand for goods along these lanes. With the decrease of U.S. imports from China, new sourcing strategies are beginning to emerge for U.S. imports.
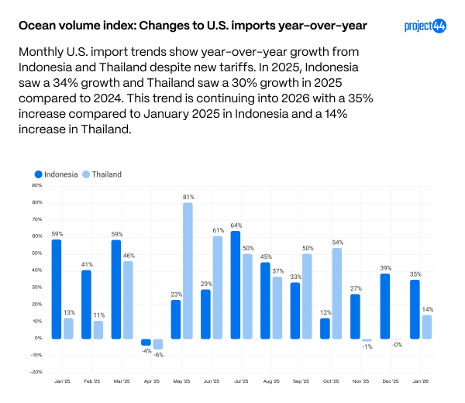
With volumes out of China decreasing, Indonesia and Thailand are emerging as alternative suppliers, with imports up 30% from Thailand and 34% from Indonesia in 2025 compared to 2024. Both countries still face tariffs (+19% since January, plus product-specific surcharges), but demand has nevertheless grown throughout 2025.
Despite overall growth throughout the year, April marked a decrease from both countries considering the “Liberation Day” tariff announcements, and both November and December show decreases on imports from Thailand compared to 2024. Despite two consecutive months of declines, January 2026 showed a strong 14% increase compared to 2025, showing that the earlier declines could have been driven by seasonality and other factors. Indonesia does continue to show higher growth at a 35% increase in January. This is particularly staggering when we consider this is a 35% increase from January 2025, which saw a 59% increase compared to January 2024. Indonesia continues to emerge as a strong sourcing alternative.
Summary
Overall, 2025 data highlights the significant impact of tariff-driven disruption on U.S. trade flows and carrier scheduling decisions. Blank sailings peaked mid-year before steadily declining, reaching their lowest levels in over a year by January 2026, suggesting a return to more stable sailing schedules. Trade volumes between the U.S. and China declined sharply on both the import and export sides, reflecting the continued pressure of reciprocal tariffs despite brief improvements late in the year. As imports from China slow, U.S. importers are increasingly shifting sourcing strategies toward Southeast Asia, with Indonesia in particular emerging as a strong alternative supplier.