EXPECTATION vs. REALITY
How do supply chains contribute to stakeholder expectation management and where do they fall short? Customers expect product availability and on-time delivery; employees expect a fulfilling job with healthy work-life integration; suppliers expect realistic forecasts; carriers expect healthy asset utilization; shareholders expect a return on their investment.
I believe poor expectation management is a symptom of the deterministic and static nature of supply chain planning. I’ve been reflecting on the way supply chains run long-, medium-, and short-range planning, their deterministic nature, and how probabilistic models — supported by digitalization — can build the needed flexibility to manage expectations across the value chain, and boost our risk immune system.
The argument supply chains are brittle because they rely on deterministic planning isn’t a new one. Most, if not all, supply chains depend on deterministic planning, focused on ‘one unified plan’ instead of leveraging stochastic models in line with real-world scenarios. They are deterministic because they’re designed to be executed against a single plan, or at best a handful of discrete scenarios, making them inflexible and unadaptable.
The problem with this approach is its dependence on latent and time-consuming supply chain analysis, which limits the number of scenarios which can be planned for simultaneously. The time and effort required to build these forecasts and propagate them through the supply chain makes them difficult to change, and their static nature makes them easy to break. This leads to an inevitable, and often significant, gap between actual vs plan, impacting financial statements directly, such as increased COGS on the P&L and excess inventory on the balance sheet, and indirectly, such as personnel productivity decreases as a result of constant firefighting.
BRITTLE SUPPLY CHAIN MODELS
In my time working at, and with, many of the largest supply chains in the world, I found the supply chain planning and execution process to unfold roughly the same way. Long term planning is driven by the S&OP process, mid-term by master scheduling, and short-term by material requirements planning, with distribution requirements planning and capacity planning enabling the flow of products through the value chain and into the hands of the end customer.
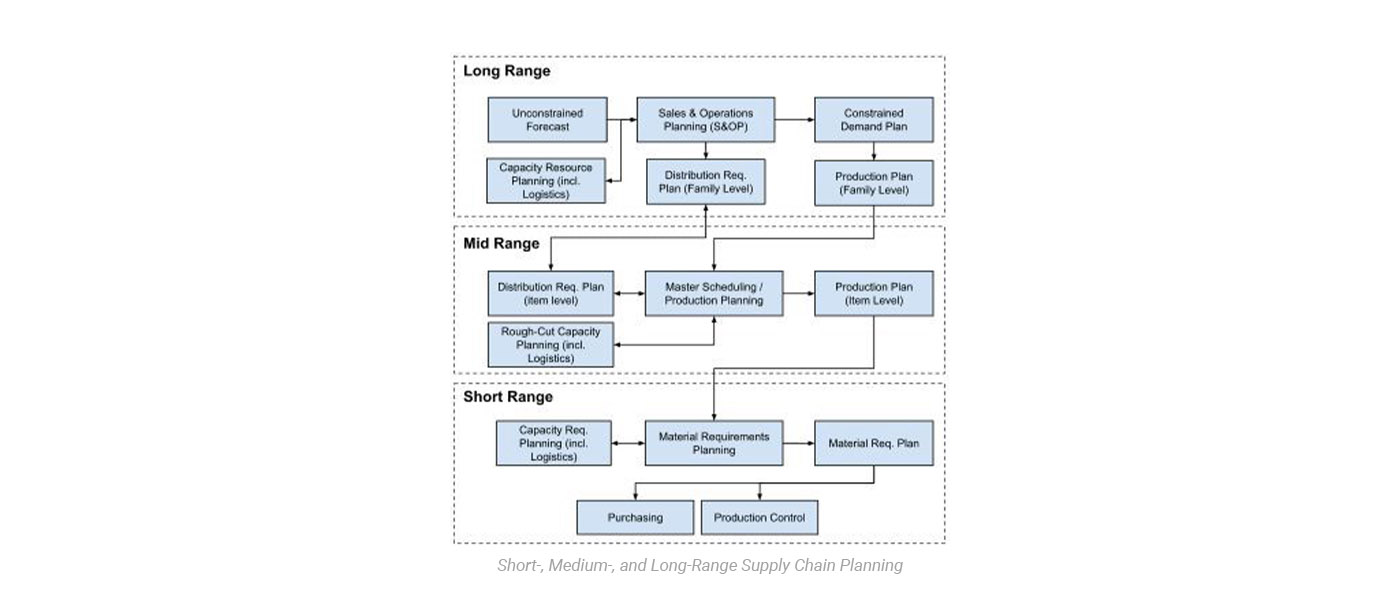
The primary focus of this model continues to be on achieving a consensus forecast through ‘one unified plan’ which, at best, is revisited every 4–6 weeks. This plan is then propagated across the supply chain network informing master production schedules, material requirements plans, distribution requirements plans, capacity plans, and so on and so forth.
There are three major contributing factors to this problem:
- Inability to access the high-quality data needed to generate reliable information and actionable insights.
- Missing the digital infrastructure needed to automate decisions, or at the very least, provide teams with the analytics to support scenario-planning and decision-making.
- Clunky processes creating inefficiencies in cross-functional and cross-enterprise collaboration.
These constraints are symptoms of siloed systems and fragmented processes, resulting in the inability to source timely and granular data; assess and improve its quality; distill and surface information and insights where needed, when needed; and facilitate cross-functional and cross-enterprise collaboration to improve decision-making.
This sets off a vicious cycle increasing risk, impacting financials, and frustrating stakeholders:
- Supply chain plans are created with weeks-old, if not months-old, data pulled from systems with limited quality controls
- The lack of continuous intelligence about the state of operations on the ground prevents the feedback loops necessary to adjust plans in-flight. This increases the margin of error between forecast and actual as the plan unfolds
- The inability to adjust plans in-flight erodes trust in both the information being disseminated across the supply chain, and in the teams sharing the information
- Teams go back to making gut-feel decisions creating even more variability in the data being captured.
THE BENEFITS OF PROBABILISTIC PLANNING
So, what do we mean by probabilistic planning? Simply put, it’s using probability distributions as inputs to decisions instead of exact numbers. This helps offset uncertainty by measuring the likelihood of achieving revenue, margin, and cash flow targets given real-world constraints such as transportation lead time, production output, and inventory availability. The ability to continuously access the high-quality data needed to build a historical record at a granular level is essential to developing these probability distributions and keeping them updated.
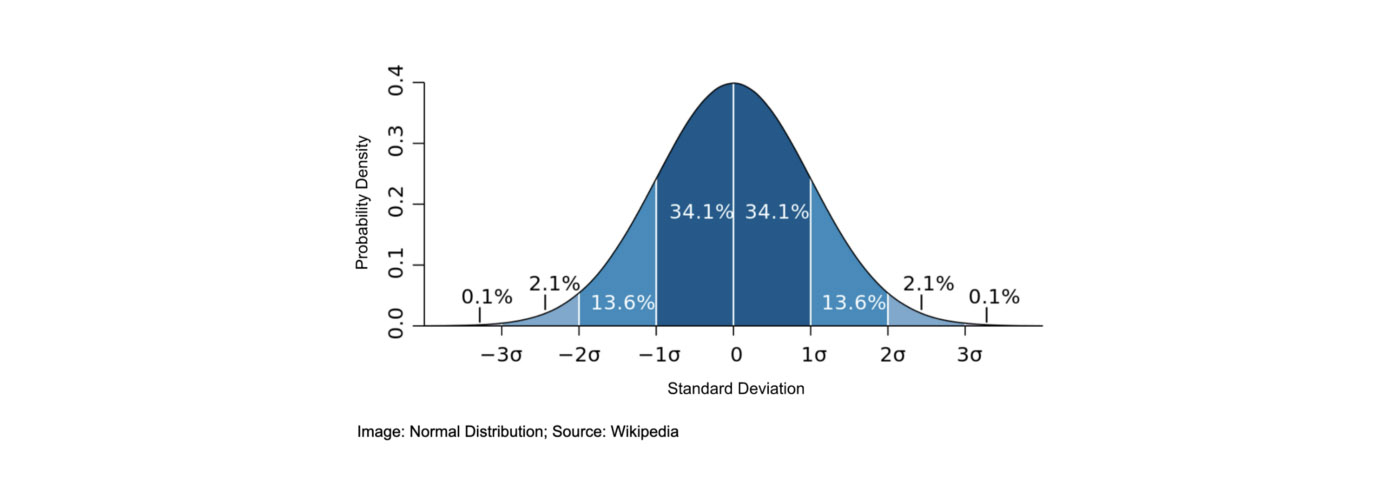
Let’s look at transportation lead time as an example. It’s common for companies to depend on lead time averages by lane, or worse, carrier SLAs to inform their order fulfillment cycle times and inventory levels. Doing this doesn’t take into consideration the total lead time or standard deviation in lead time by carrier, route, service, and seasonality.

In contrast, collecting granular shipment data and constructing a probability distribution for lead time helps us evaluate the tradeoffs between cost and performance, e.g., how awarding capacity to certain carriers and moving product via certain lanes impacts production, OTIF, and safety stock.
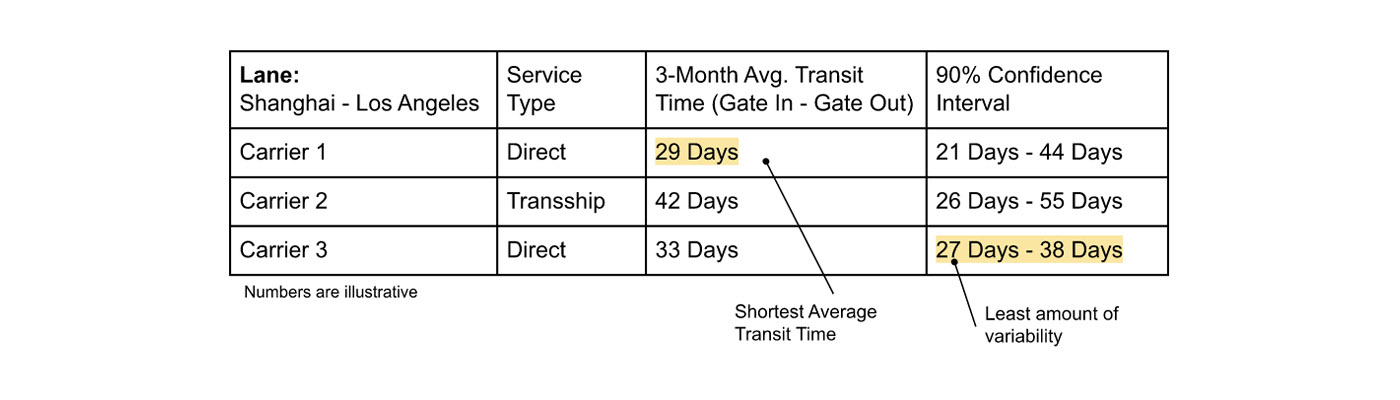
In the table above, carrier 1 provides the shortest average ocean transit time of 29 days, but exposes operations to 23 days of variability for 90% of shipments. In contrast, carrier 3 has a longer average transit time, but is more reliable. Understanding the variability in the probability distributions for inputs to key operational metrics improves scenario planning — is accounting for variability in 80% of cases sufficient? 90%? What happens when things do not go to plan? How do risks introduced in one part of the system impact available options in another?
Leveraging probability distributions reduces overall supply chain risk by optimizing sourcing, capacity allocation, and network design to improve the likelihood of a desired outcome. Additionally, these probability distributions support powerful predictive models which act as feedback loops to adjust plans and control risk.
As an example, measuring the probability distribution of lead time for raw materials feeding manufacturing facilities enables optimal carrier capacity allocation and routing to find the balance between COGS, safety stock, and service levels. Additionally, feeding production plans with continuous intelligence in the form of predictive ETAs helps systems constantly re-evaluate the impact of exceptions on production, inventory, fill rates, etc. Options can then be evaluated in real-time, and preventative measures taken, to mitigate these risks by adjusting production schedules, reallocating inventory to high-priority customers, or if needed, expediting raw materials at a higher cost.

Utilizing probabilistic models to improve planning reduces unexpected variability, and as a result, the frequency of exceptions; utilizing these models to create feedback loops supporting in-flight operations can have a significant impact on reducing the magnitude of exceptions. Both have a considerable influence over achieving business outcomes and reducing overall value-at-risk.
LEVERAGING REAL-TIME TRANSPORTATION VISIBILITY
Becoming data-driven is the first step in shifting from a deterministic to a probabilistic supply chain model. Actually, the first step is building a data-first culture, but let’s skip ahead to becoming data-driven. One of the biggest barriers to building a data-driven supply chain is the inability to deploy the infrastructure capable of collecting high-quality data to inform decisions at scale.
Transportation has languished in this area for a long time. Predominantly, because it’s grown into a highly fragmented industry with many players, siloed systems, and disconnected processes, let alone various global requirements for data-sharing and privacy. This fragmentation has prevented even the largest, tech-savvy companies from gaining reliable visibility to transportation capacity utilization, transportation performance, and inventory flows across their network.
The visual below illustrates how using static averages / SLAs leads to increased variance as products move through the supply chain. The increasing deviation of actual from plan, combined with the lack of continuous intelligence on the health of product flow, results in lost market share, decreased margins, poor cash flow, and low customer satisfaction. Offsetting these risks often requires last minute heroics at substantial cost.
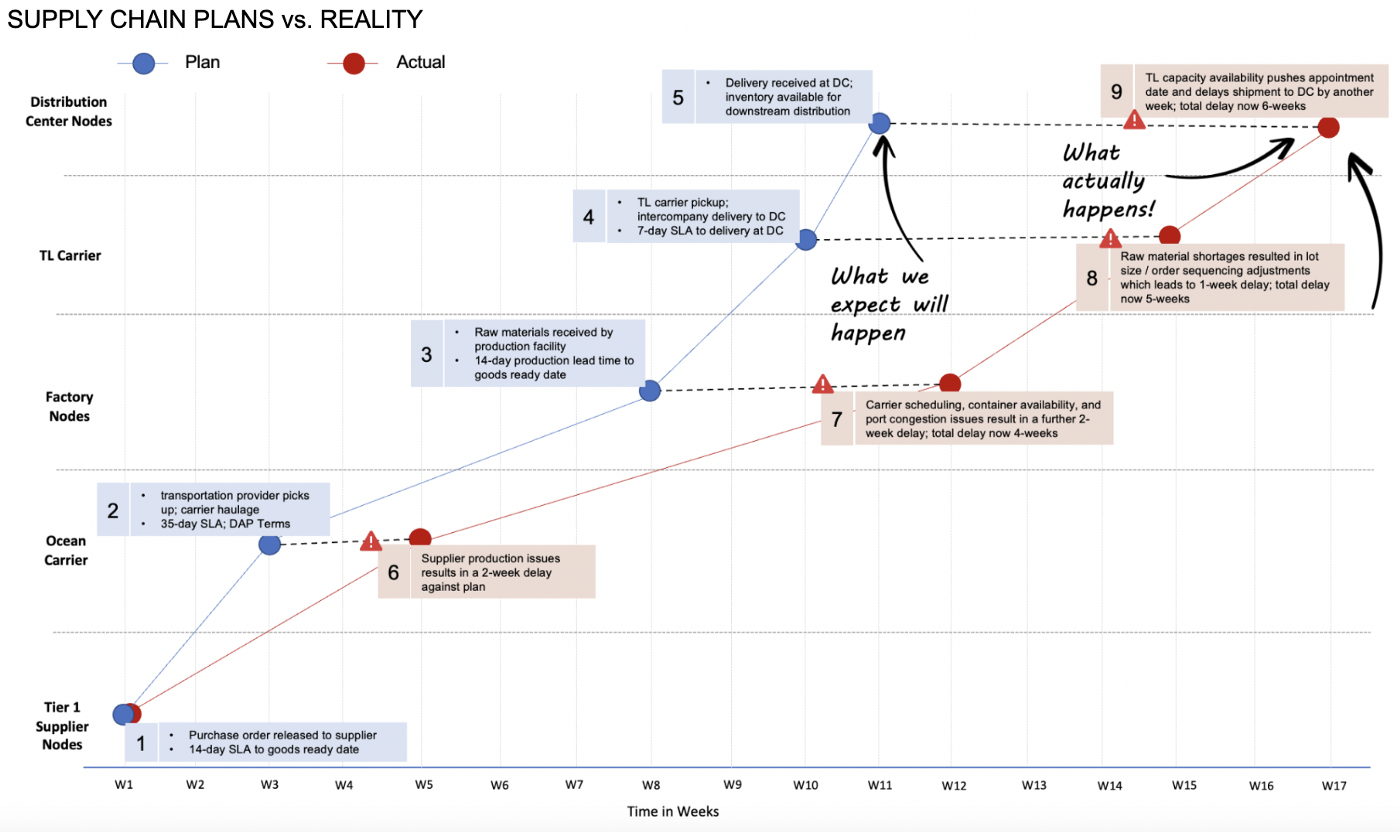
The root cause of issues ties back to the constraints we mentioned earlier — a) the lack of continuous intelligence to aid in data-driven planning and exception management; b) inability to deliver this information where needed, when needed; c) fragmented cross-functional and cross-enterprise processes.
Real-Time Transportation Visibility (RTTV) eliminates these constraints by providing companies with a scalable and cost-efficient solution capable of feeding all supply chain stakeholders high quality multi-modal transportation data and ETAs at the item level, allowing them to track products flowing across the value chain — from raw material suppliers to finished goods on store shelves and to the doorsteps of end customers. Being able to accurately plan, monitor, and control inventory flow across the network can transform how companies manage their supply chains, making this information a massive competitive advantage for shippers and carriers.
Effectively deploying the data points provided by RTTV to drive probabilistic planning and execution provides major benefits. From a supply chain planning perspective, RTTV provides several critical inputs to:
- Improve the accuracy of safety stock planning at each echelon
- Inform distribution networks: carrier selection and routing; product mix at DCs given ability to resupply within desired lead time
- Drive adjustments to production plan time fences and ATP calculations based on cumulative lead time; adjustments to lead time offsetting in the material requirements plan
- Assess tradeoffs between service, quality, and cost to optimize transportation capacity allocation
- Increase the accuracy of forward and backward scheduling and corresponding delivery commits
- Improve supply chain continuity planning and reduce overall value-at-risk
- Become the shipper of choice by a) identifying and eliminating bottlenecks impacting carrier asset utilization; b) increasing the accuracy of forecasts, i.e., when and where capacity is required.
From a supply chain execution, monitoring, and control perspective, RTTV provides critical inputs to:
- Mitigate the impact of carrier schedule variances on downstream delivery dates
- Stay on top of in-transit shipments and ETAs to assess impacts to downstream operations and mitigate risks to production schedules, downstream inventory availability, and customer orders
- Improve customer satisfaction with proactive and reliable customer communication
- Improve personnel productivity by reducing time spent on order tracking, exception management, customer service, and reporting
- Manage data-driven supplier and carrier relationships.
The visual below highlights a few of these benefits:
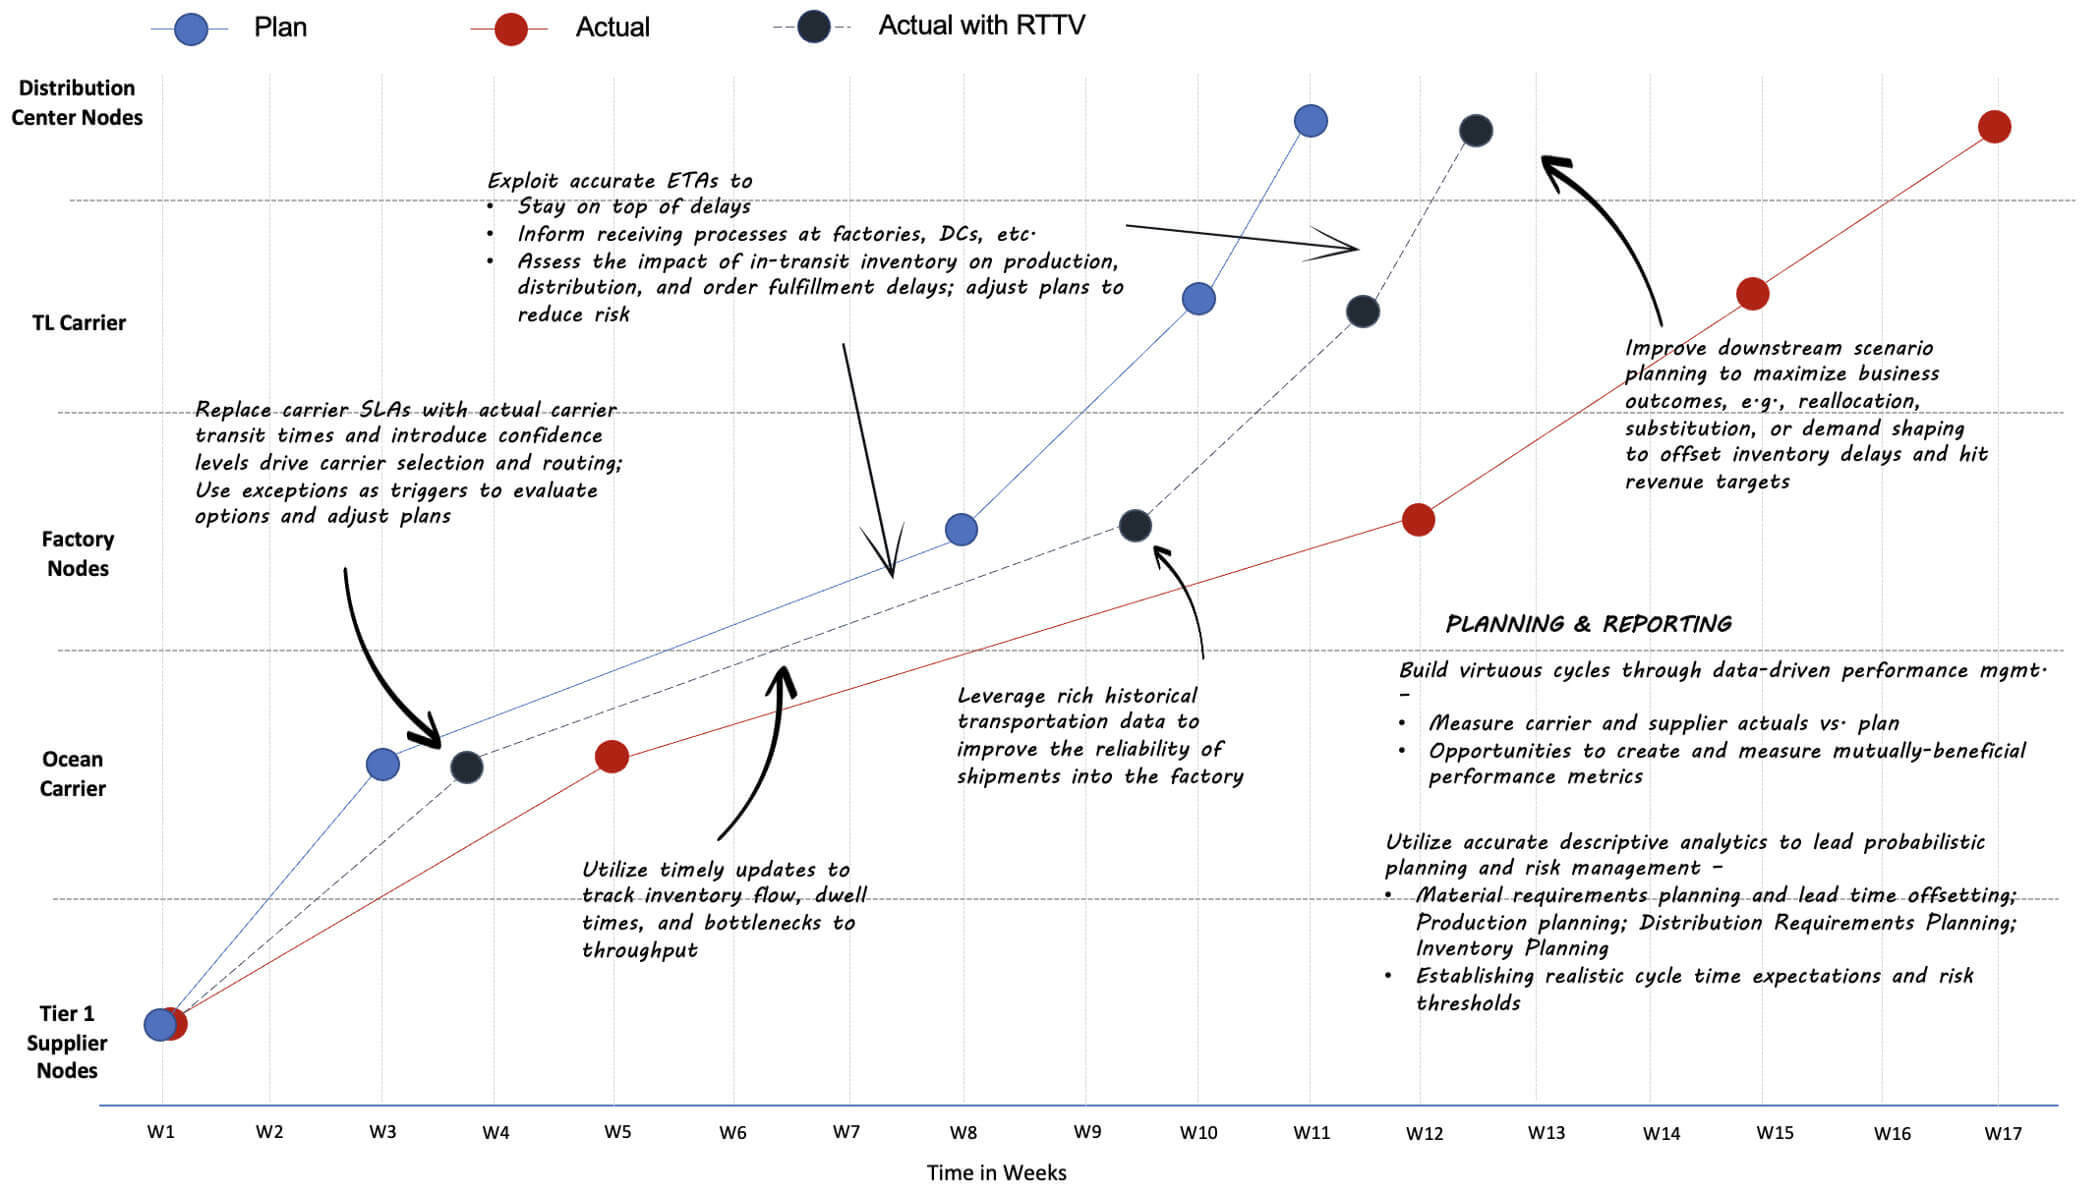
Over the past few decades, global supply chains have invested in becoming very efficient, but they’ve done a poor job balancing that efficiency with the flexibility and agility needed to deal with uncertainty. Shifting from a deterministic model to a probabilistic one helps rebalance the equation by allowing companies to manage tradeoffs between key metrics and drive optimal outcomes given real world conditions.