The Impact of Increased Vessel Delays and Rising Transportation Costs
Recent vessel-tracking data from project44 reveals substantial year-over-year increases in vessel and shipment delay times across most major trade lanes connecting China to the rest of the global economy. These longer lead times cast a spotlight on already overburdened transportation networks and ongoing supply chain disruptions. For many businesses, the unrelenting supply-side bottlenecks and increasing transportation costs are impacting their ability to meet customer demands and forcing them to pass costs on to their customers, causing upward pressure on global inflation.
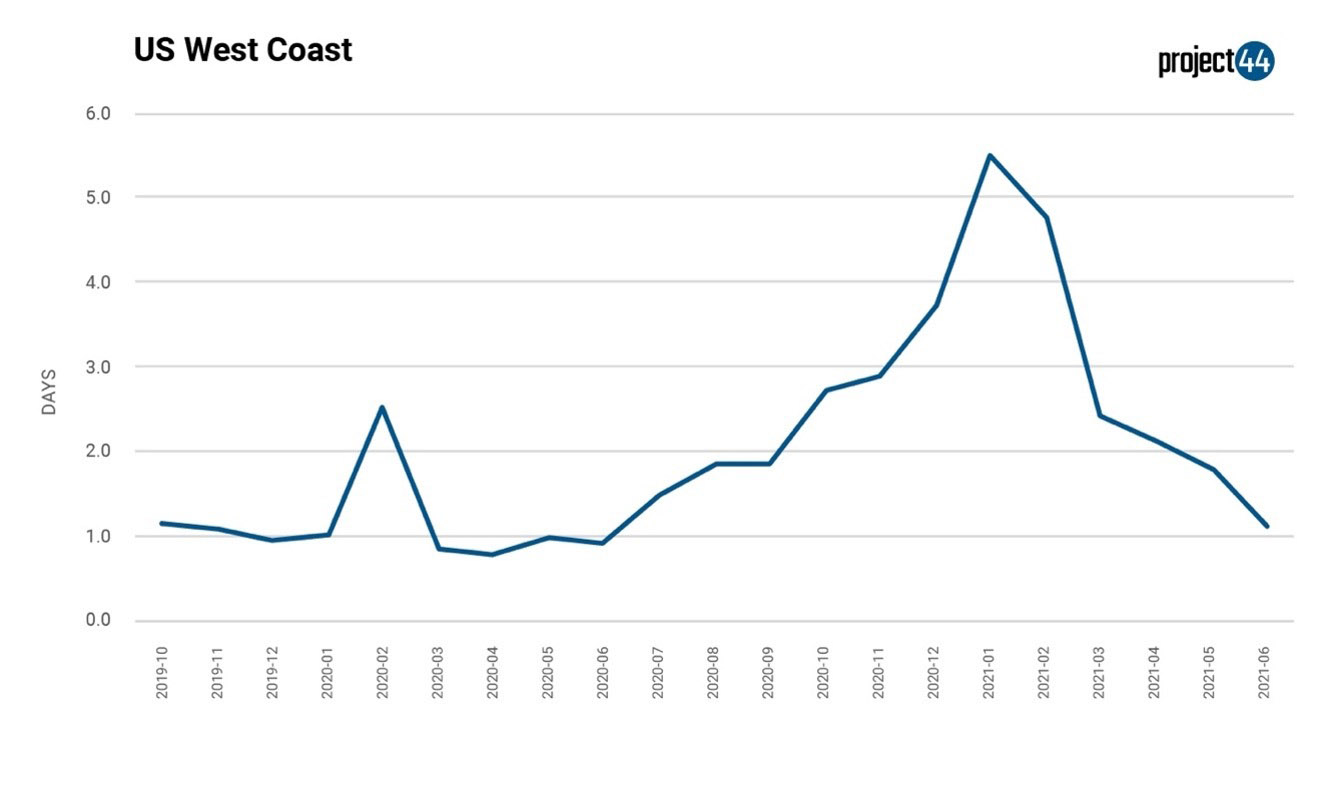
While select China-US West Coast routes schedules have improved significantly over the past months, data gathered by project44 shows that along many critical routes, multi-day delays remain high, or are even rising in the face of recent outbreaks of the COVID variant in southwestern China. This indicates that global supply chains remain fragile and far from quickly returning to pre-COVID levels.
Shipping delays by route
There were substantial delays for ships operating on routes between China and US non-West Coast ports, where ship delays increased from 0.6 days on average in July 2020 to 2.44 days in July 2021. For example, year-over-year, median delays for ships traveling from Tianjin to New York increased from 0.96 to 7.29 between June 2020 and 2021.
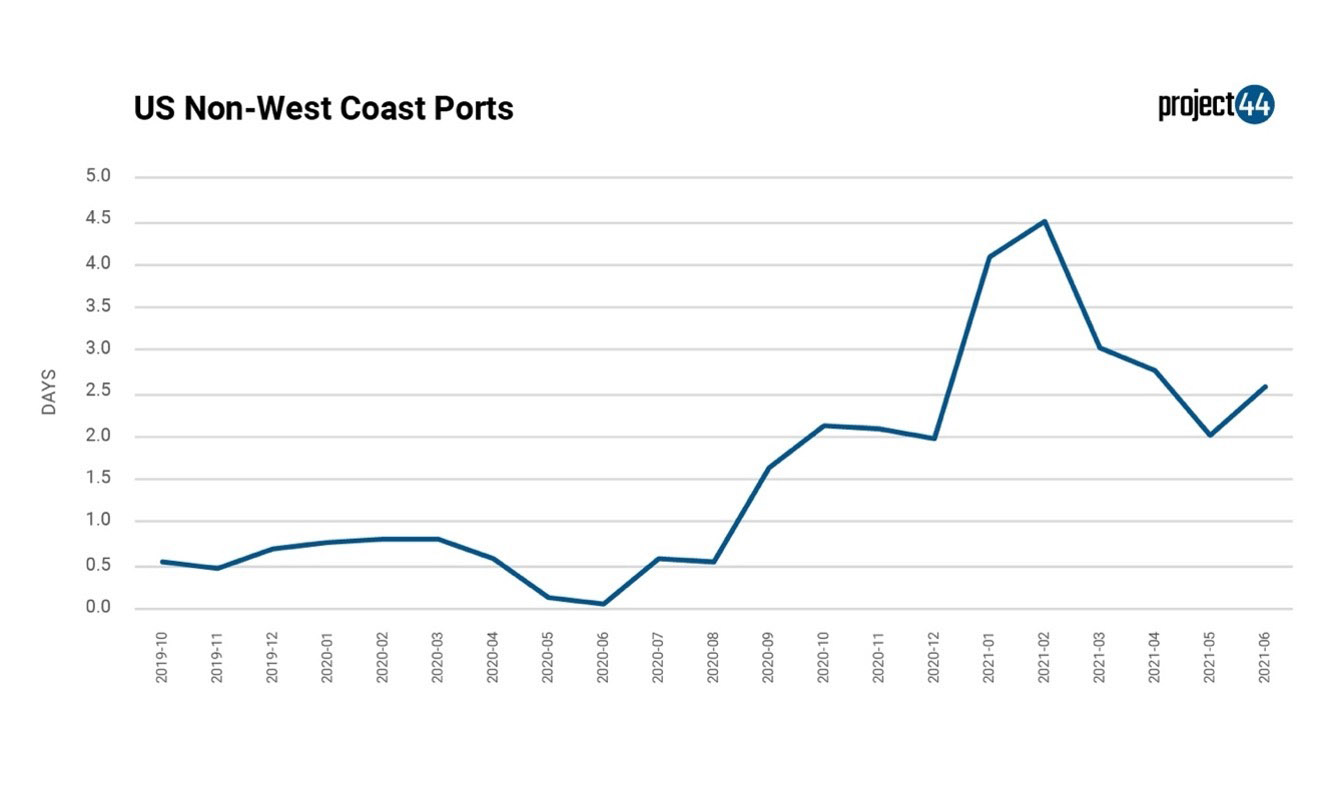
Delays in other ports of US were steady from last quarter of 2019 until August 2020 when they started rising to a peak in February 2021. Moderate improvements have been made with delays working their way down as of June 2021.
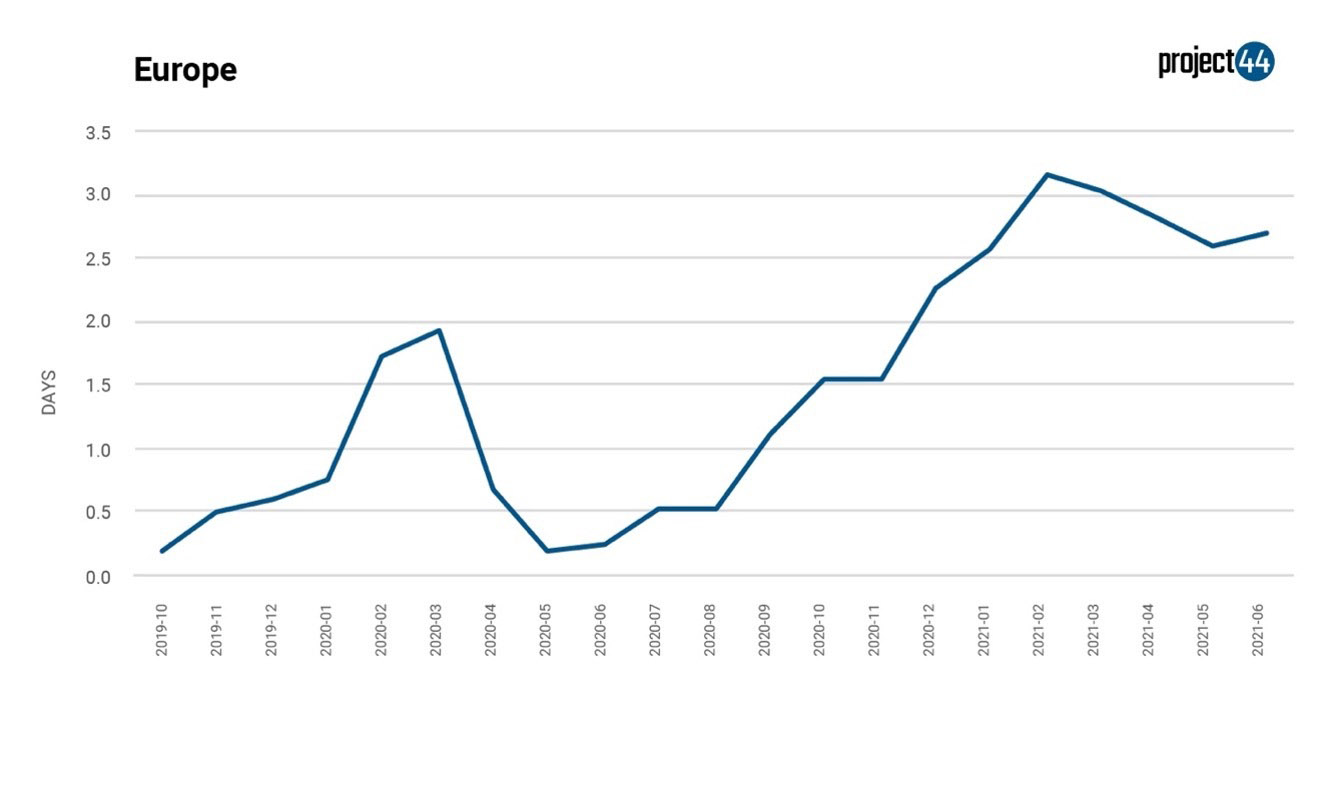
For China-EU maritime traffic, delays increased from an average of 0.51 days in July 2020 to 2.18 days in July 2021.
As of June 2021, Shanghai-Hamburg and Shenzhen-Hamburg were representative of other modern, high-volume China-EU port pairs, seeing median ship delays extending more than a week, at 8.44 and 7.86 days, respectively. For ships traveling from Tianjin to Antwerp in June, the median delay was 11.42 days.
Delays in EU trade started increasing from December 2019 when the first impact of COVID-19 was felt in China. Delays peaked in March 2020 but dropped in May 2020, possibly due to China coming out of COVID-19. They started rising again from July 2020, peaking in February 2021 when the rest of the world was battling with COVID-19. The delays were working their way down as of July 2021, but still at levels higher than the 2020 peak.
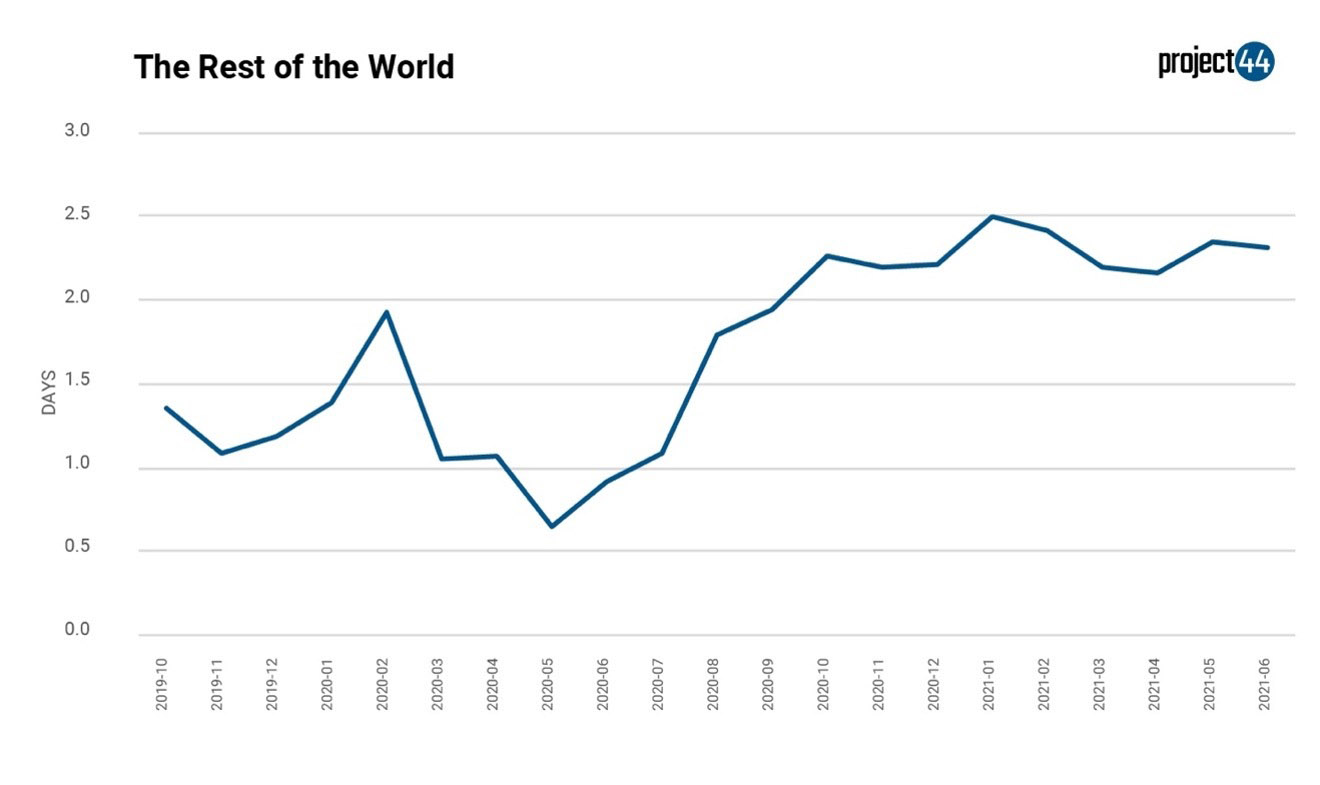
For the rest of the world (ROTW) as a category, YOY delays increased from 1.08 days to 2.78 days between July 2020 and 2021. While not as extensive as the worst-hit EU and US ports, this suggests that most trade lanes are affected.
Delays in the ROTW trade started increasing from December 2019 when the first impact of COVID-19 was felt in China. It peaked in February 2020 but dropped in May 2020, possibly due to China coming out of COVID-19. Delays started rising again from June 2020, possibly due to the ROTW feeling the impact of COVID-19, with the numbers peaking in July 2021. It is currently at its highest level since August 2019.
“The fact that ships remain delayed and now COVID variant outbreaks in major Chinese manufacturing hubs are on the rise, indicates that there may be far-reaching down-stream consequences going into Black Friday and holiday shopping seasons,” said Josh Brazil VP Marketing project44. “We’re seeing a lot of variation in delay times between months, and routes such as US West Coast versus East Coast ports, making supply chains particularly challenging for shippers to manage.”
“One of the few givens in 2021 is endemic delays, and the fact that conditions can change almost overnight,” said Josh Brazil, VP Marketing project44. “These latest numbers along with COVID variant outbreaks are a warning to shippers that they won’t be able to mitigate losses associated with delays and bottlenecks unless they have a complete and real-time view of vessel delays, ports, and carrier performances.”
Disclaimer: The data referenced in this release is sourced from project44’s freight visibility platform, based on the logistics indicators that the platform tracks. The sample data sets referenced do not include all freight movement data tracked by other entities. Data from project44’s platform reflects a statically significant sample size to draw conclusions