In recent times, conflicts in the Red Sea have given rise to significant challenges in global shipping. The ramifications extend far beyond the immediate region, influencing various aspects of the international supply chain. This blog post delves into the rising costs, increased transit times, and far-reaching impacts on global trade resulting from the Red Sea crisis.

Rising Costs
Container Rates Surge
Container rates from Asia to the US have experienced fluctuations since the onset of the Red Sea crisis. Despite not utilizing the Red Sea shipping lane, costs have surged dramatically. According to CNBC, rates from Asia to the East Coast have risen by 146%, while those to the West Coast have seen a staggering increase of 186%.
Extended Routes and Operational Costs
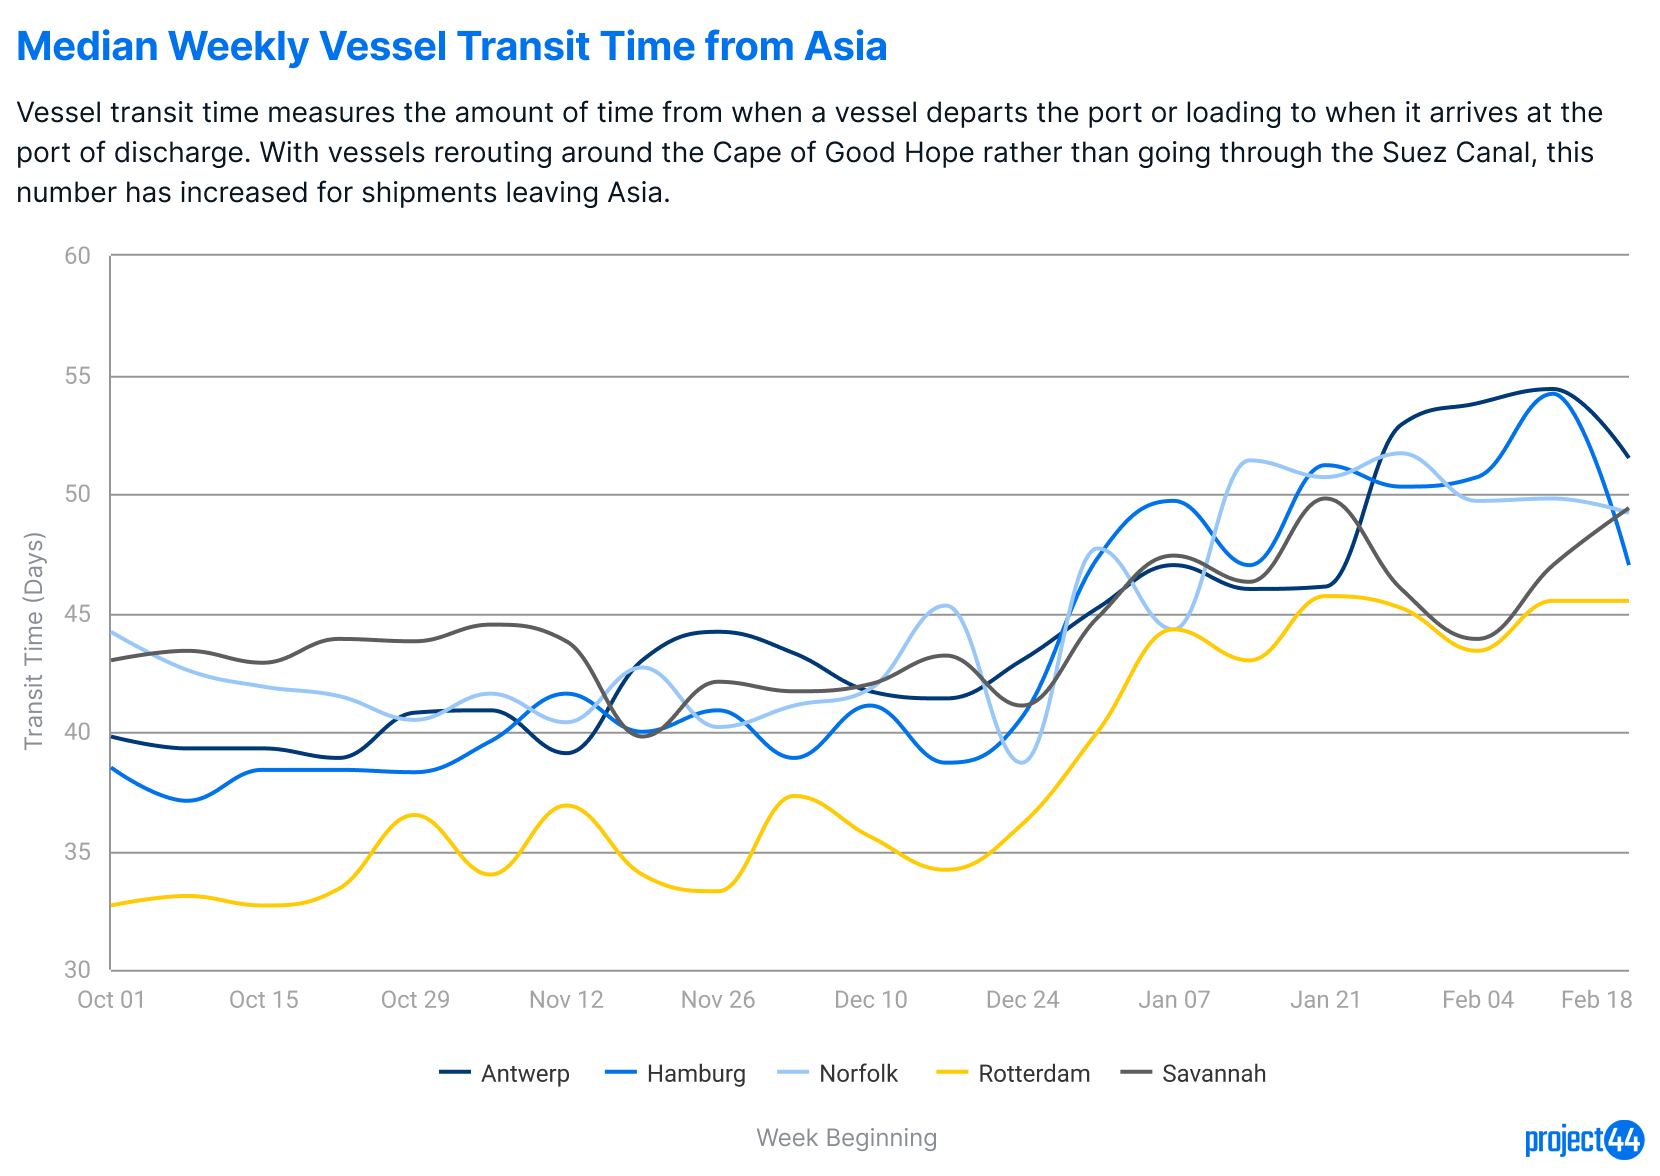
Choosing to circumvent the Red Sea by traveling around the Cape of Good Hope adds approximately 9000 km (about 5592.34 mi) to a vessel’s journey. This detour can result in a 7-20 day increase in transit time, depending on the vessel’s speed. Freightwaves notes that a Panamax container ship traveling between 20 and 25 knots/hour consumes 63,000 gallons of marine fuel per day. With an additional 7 days in transit time, rerouting vessels incur an extra 441,000 gallons of fuel, significantly raising operational costs. There are also increased costs associated with the labor on board for longer periods of time.
Increase in Transit Time
Decline in Red Sea Volumes
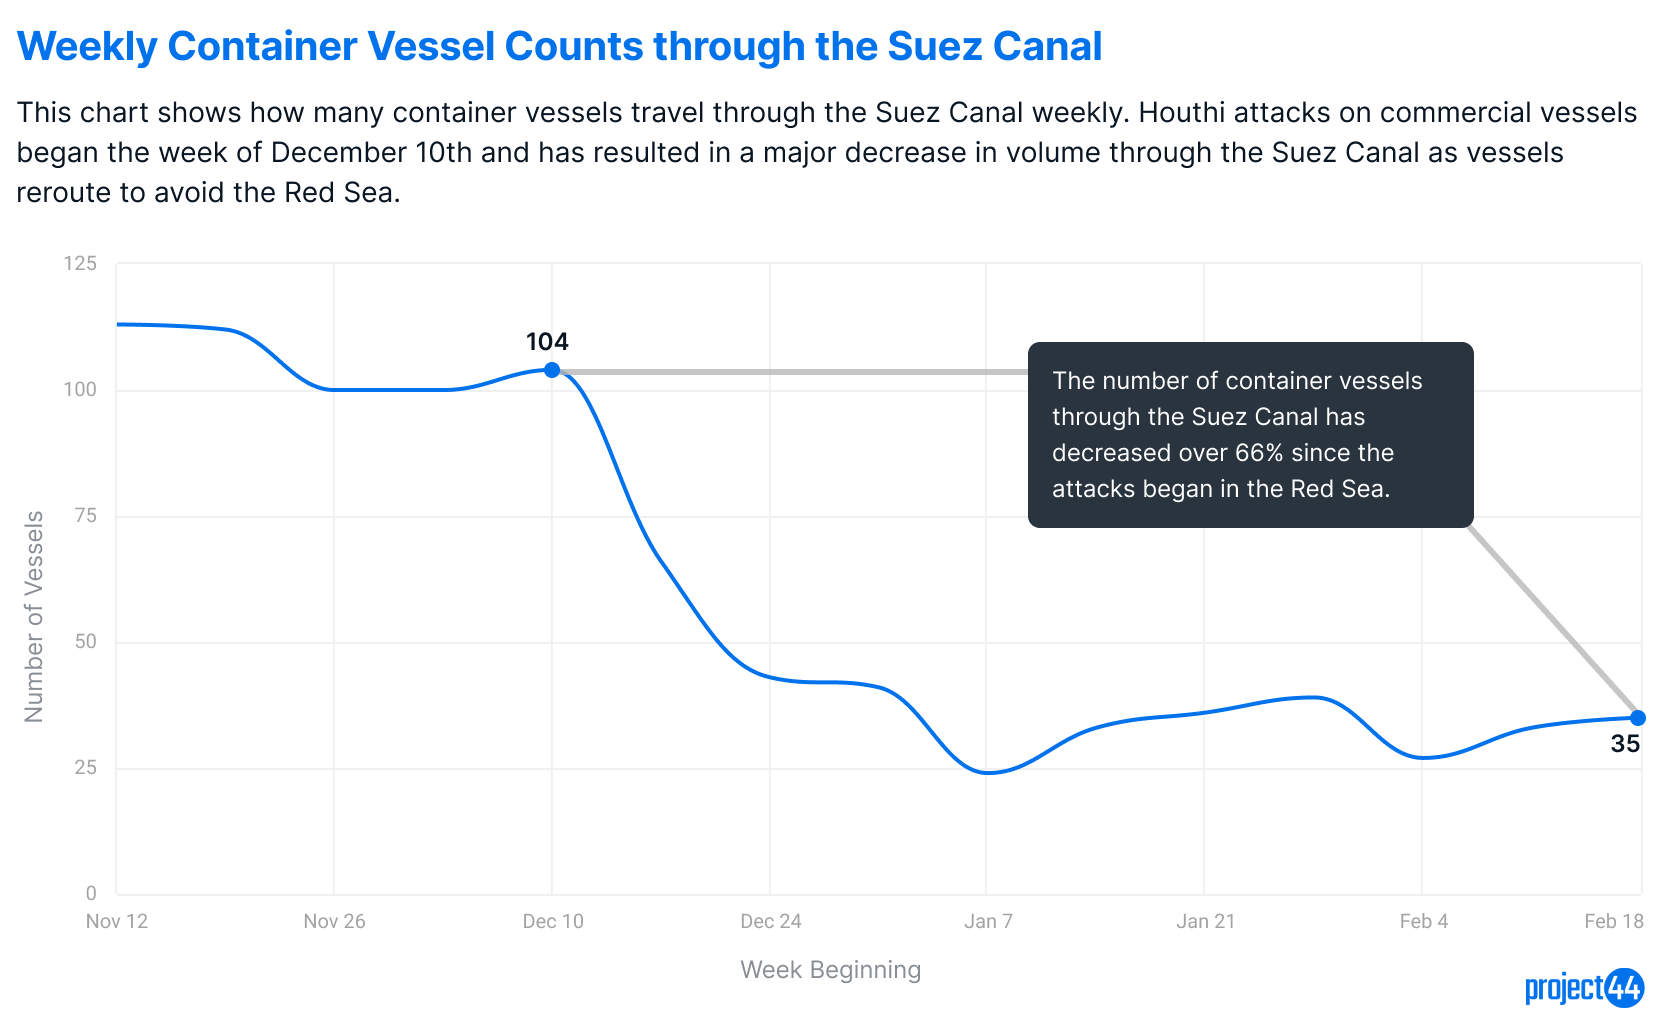
To avoid the Red Sea, most vessels have chosen alternative routes, leading to a plummet of over 60% in shipping volumes since the crisis began. project44 data has identified 562 vessels rerouting, reflecting the severity of the situation.
Changes in Vessel Schedules
Containers traveling these alternative routes are facing projected delays of 10-12 days, impacting carrier scheduling. Carriers are adjusting the schedule on these lanes and adding a median amount of 9-12 days depending on the lane.
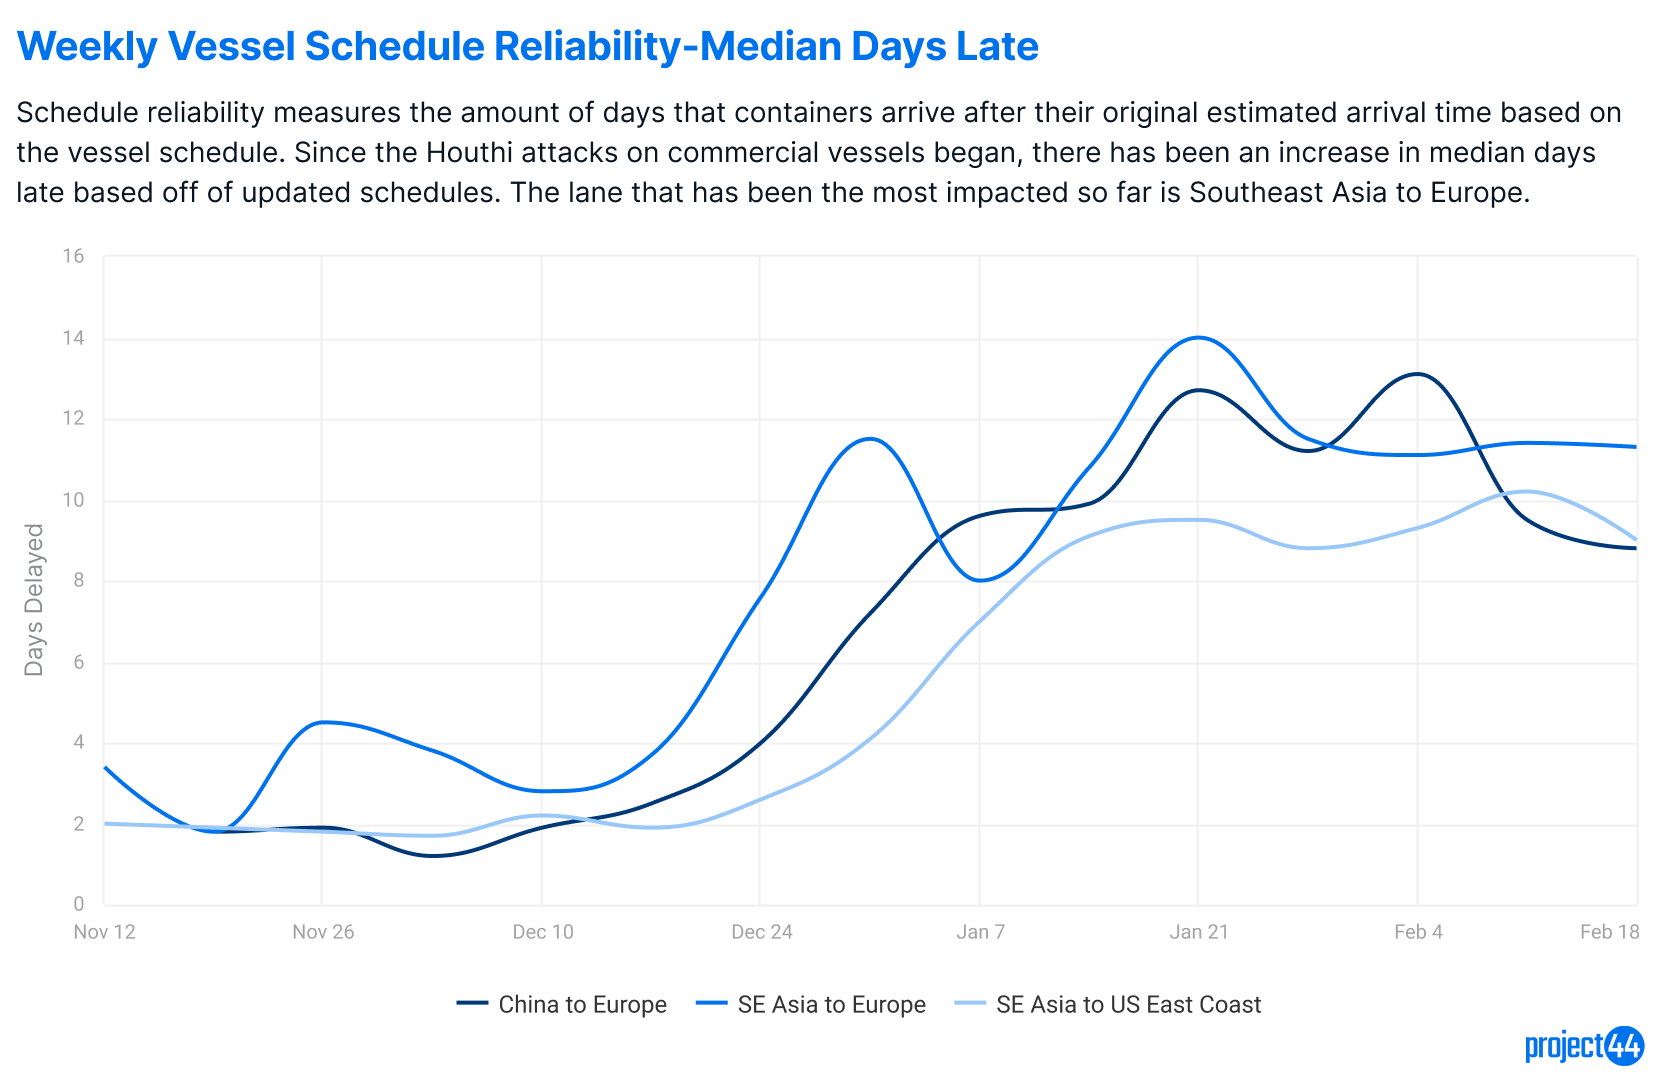
As containers that were rerouted land at final destinations, we are observing significant increases in median transit times, with most lanes seeing a median amount of 10 days in additional transit time.
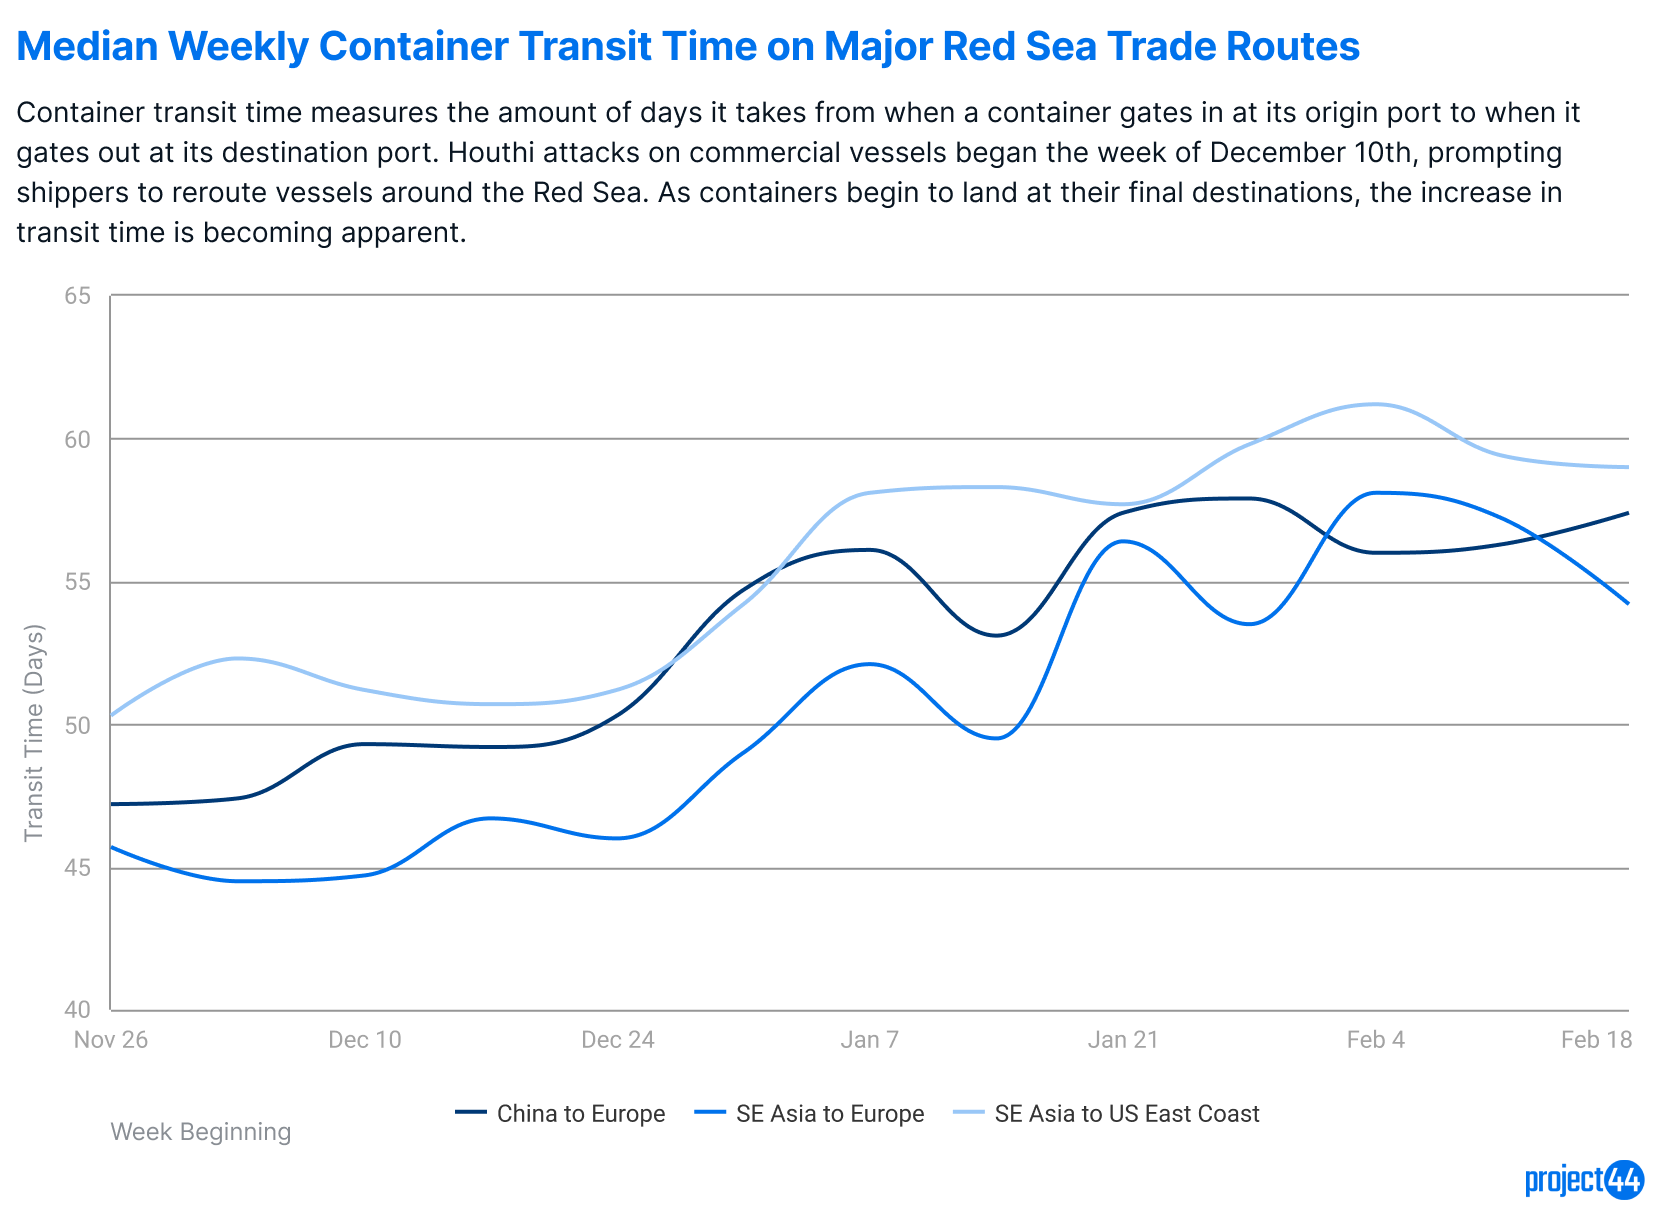
Here are some examples of the transit time increases on a port level, which does continue the trend seen in the chart above at the regional level.
Impacts
Downstream Inventory Issues
The unanticipated increase in transit time has left companies grappling with downstream inventory issues. Companies operating on just-in-time (JIT) supply chains, such as Tesla, Volvo, and Whirlpool, have already announced manufacturing disruptions due to parts shortages. Adjusting ordering processes for the extended transit time or resuming shipments through the Red Sea is crucial to mitigating these disruptions.
Inflation
The rising costs of shipping may force companies to either absorb revenue losses or pass the burden onto consumers through price increases. There is also a likelihood of some supply shortages, which creates an opportunity for companies or individuals to buy up limited stocks and re-sell them for extreme margins. This behavior was observed during the COVI-19 pandemic with goods ranging from day-to-day needs like toilet paper, PPE needs like masks, and luxury goods like Nintendo Switches and PlayStation 5s. Luckily, these shortages should be much more limited as plants are continuing to be manufactured and goods are continuing to be shipped, just at a slower rate than prior to the conflict.
Disruptions to Global Food Supplies
International Food Policy Research Institute warns of potential disruptions to global food supplies. Inflation’s impact on food prices, coupled with the war in Ukraine affecting wheat trade, could extend to wheat exports from Russia and the EU. Countries dependent on these regions, like East Africa, may face wheat shortages. Eritrea, Somalia, and Pakistan, which rely on these sources for over 80% of their wheat, are particularly vulnerable.
Economic Impacts in Egypt
Egypt, which is where the Suez Canal is located, is experiencing severe economic impacts. With vessels rerouting to avoid the Red Sea, Egypt has witnessed a staggering 40-50% decline in revenue. Considering that the canal brings in billions of dollars annually, this is a large sum of money that the Egyptian economy is missing out on. The crisis has affected not only container vessels but also cruise lines, tankers, and various other vessels avoiding the region.
Conclusion
In conclusion, the conflicts in the Red Sea are rippling through the global supply chain, causing disruptions, increased costs, and far-reaching consequences. As stakeholders navigate these troubled waters, adaptation, and strategic planning become imperative to weather the storm and sustain the resilience of the international trade ecosystem.