Summary:
- Blank sailings rose sharply year over year from 2024 to 2025 across major lanes, with tariff-related disruptions affecting Asia to North America and Europe to North America; notably, US East Coast to South Asia (India, Sri Lanka, Pakistan) increased 185% from 7 in 2024 to 20 in 2025 YTD.
- Blank sailings have started to level out as tariffs begin to stabilize for the time being. After previously predicting major spikes, October showed low blank sailings between China and the US compared to earlier in the year, and November is projected to be a calmer month as well.
- Imports from China remain down for the 6th consecutive month, while exports remain down for the 10th consecutive month. Early data suggests some volumes shifting from China to Indonesia (+34%) and Thailand (+37%) as a source of U.S. imports.
- eCommerce on-time performance has not been impacted by the end of the de-minimis exemption. On-time performance improved by 2% between August and October.
Overview
The “Liberation Day” tariffs, which went into effect on August 7, 2025, represent the most wide-ranging tariff implementation in modern US history. While sweeping in scope, they are only the latest in a series of tariff measures introduced this year. A wide range of duties, tracked in detail in our tariff tracker, has created an uncertain and often volatile environment for global trade.
One of the clearest indicators of this shifting landscape has been an increase in blank sailings throughout 2025, reflecting reduced demand for ocean capacity as the cost to import goods into the United States rises. These capacity cuts have been concentrated on certain lanes and carriers, particularly on US-related trade routes most directly impacted by tariffs and geopolitical tensions. However, as tariff rates have mostly stabilized, new trends for US trade are beginning to emerge.
Early trends include plummeting trade rates between the US and China, an increase in US imports from Thailand and Indonesia, and a shocking 7.8% decrease in the proportion of US exports going to Canada.
Blank sailings data indicates shifting trade and capacity management
In 2025, blank sailings data illustrates how carriers are responding to tariff-driven disruption in US trade. Several US-related trade lanes have seen significant increases in blank sailing rates compared to 2024, pointing to tighter capacity control and shifting service priorities.
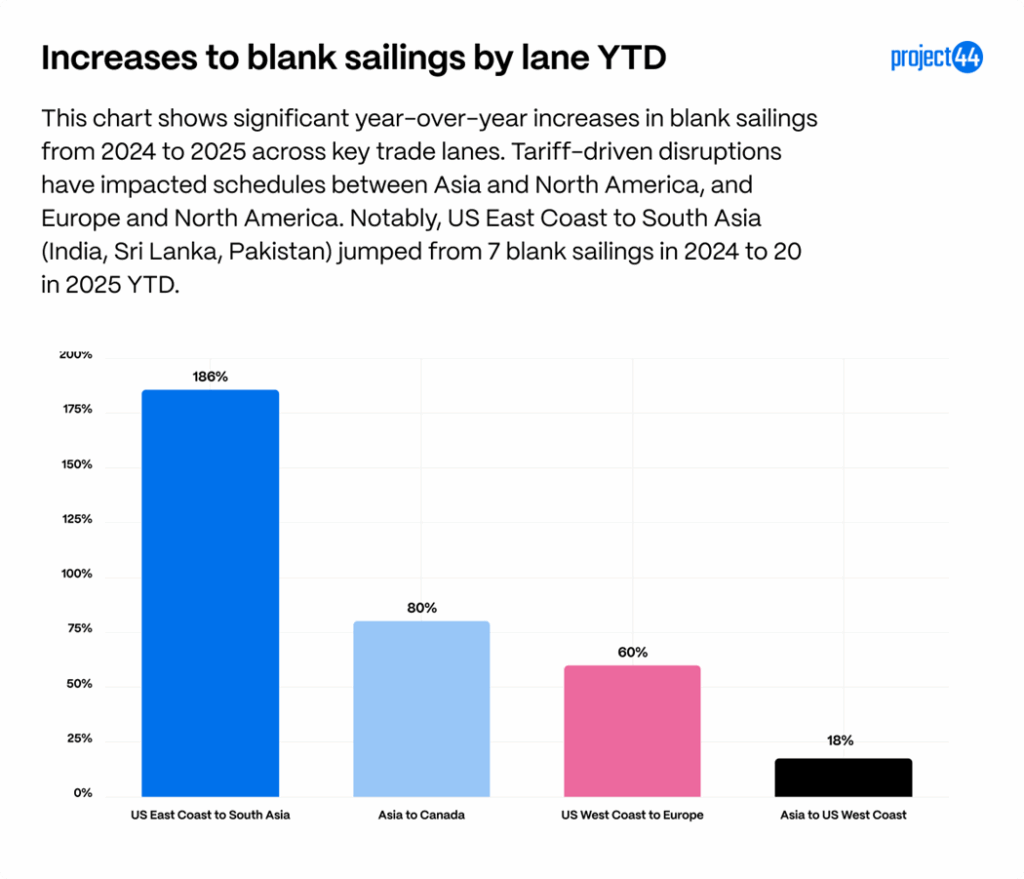
US East Coast to South Asia has shown a 186% increase compared to this time last year, implying that capacity demand for US exports to the region (which includes India, Pakistan, and Sri Lanka) are down.
Asia to Canada blank sailings increased by 80%. Many of these vessels do have port calls in the US before discharging in Canada, which can contribute to the increase in blank sailings here. Asia to the US West Coast increasing by 18% also supports that demand of Asian goods into the US West Coast has decreased throughout 2025.
Lastly, there is a 60% increase in blank sailings from the US West Coast to Europe, showing that the decreased demand for US exports expands outside of only South Asia and is prevalent in Europe as well.
Blank sailings between the US and China continue to be a point of interest in global trade. Between January 2024 and late 2025, blank sailings on US–China routes shifted from relatively stable patterns to sharp volatility.
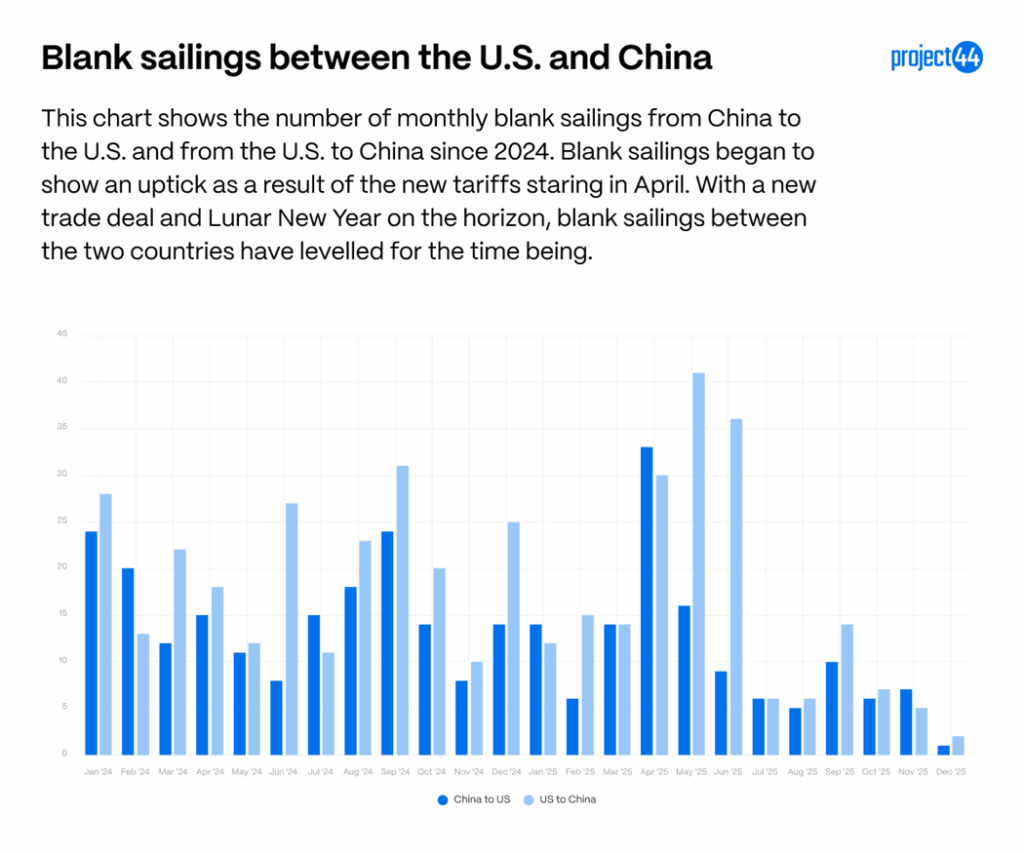
Throughout 2024, monthly cancellations generally ranged from 10–32 per direction, a steady but manageable level. That dynamic changed in 2025: blank sailings spiked in April–June, with a smaller increase again in September. Projections were even more aggressive for October, but with the possibility of 100% of additional tariffs, which were later cancelled when an agreement between the US and China, carriers cancelled blank sailings to adjust for pull-forward demand. Going into November, planned blank sailings remain low.
US trends in trade partners shift
While tariffs on major trade partner China have been reduced in recent months, their effects continue to ripple through supply chains. A closer look at US/China trade flows in 2025 reveals sharp swings tied directly to tariff actions and market anticipation.
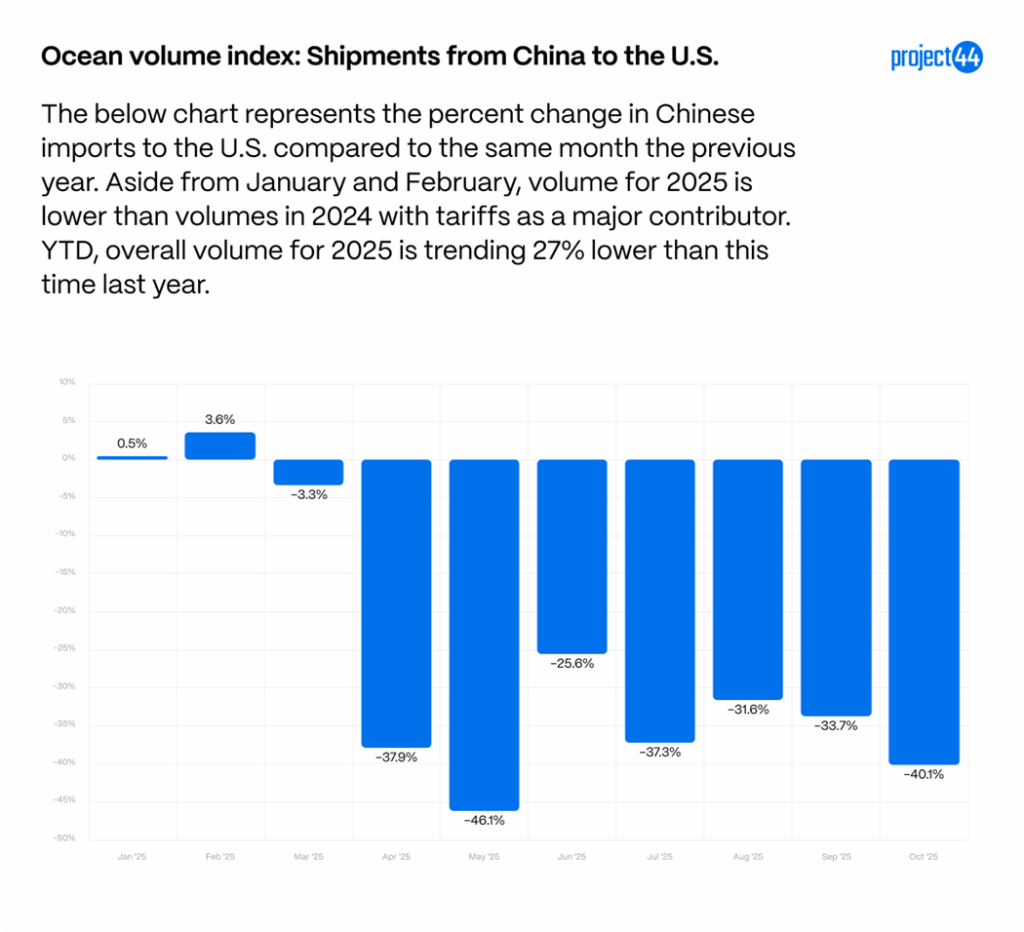
On the import side, shipments from China to the US are trending 27% lower year-to-date compared to 2024. After modest gains in January (+1%) and February (+4%), volumes fell steeply and have remained 40% lower through October compared to 2024 volumes. These swings illustrate how tariffs and front-loading behavior created early-year increases followed by sustained weakness through the summer and fall.
In response to the US tariffs, China passed their own tariffs on US goods, impacting exports from the US to China.

On the export side, shipments from the US to China are under even greater pressure, trending 42% lower year-to-date. Monthly volumes have been consistently negative against 2024, with particularly steep drops of -57% in April, -53% in May, and -53% again in August, and -56% in October. Political tensions layered on top of tariff measures are compounding the downturn, reducing demand for US goods in the Chinese market.
It is abundantly clear that the new tariffs passed by both countries have had major impacts on demand for goods along these lanes.
Ocean shipment data, however, reveals early signs of resourcing trends.

With volumes out of China decreasing, Indonesia and Thailand are emerging as alternative suppliers, with imports up 37% from Thailand and 34% from Indonesia year-to-date. Both countries still face tariffs (+19% since January, plus product-specific surcharges), but demand has nevertheless grown.
Tariff impacts on US imports and exports proportionally
While tariffs have reshaped certain trade lanes, the broader proportions of US imports and exports by country have undergone modest changes in 2025. This suggests that, despite political and economic headwinds, most US companies have not significantly restructured their sourcing or customer base.
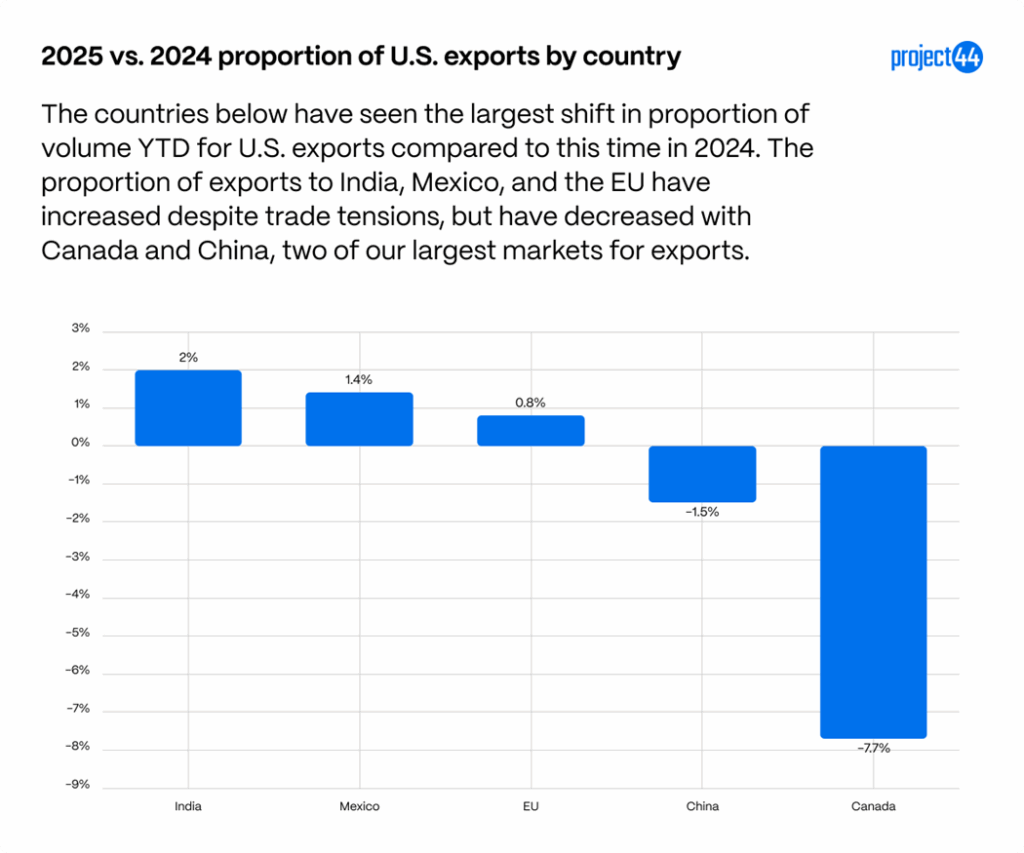
In exports, Canada, one of America’s largest export partners, stood out for a steep 7.7% year-to-date drop in its share of US exports. High political and economic tensions between Canada and the United States have fueled “Buy Canadian” movements, reducing demand of some US goods like alcohol, and contribute to the lower rate of US imports. US to China is also seeing one of the largest decreases YTD at a 1.5% decrease. Meanwhile, India (+1.9%) and Mexico (+1.4%) have posted the largest proportional export gains, likely reflecting multi-year growth trends and ongoing diversification of US export markets.
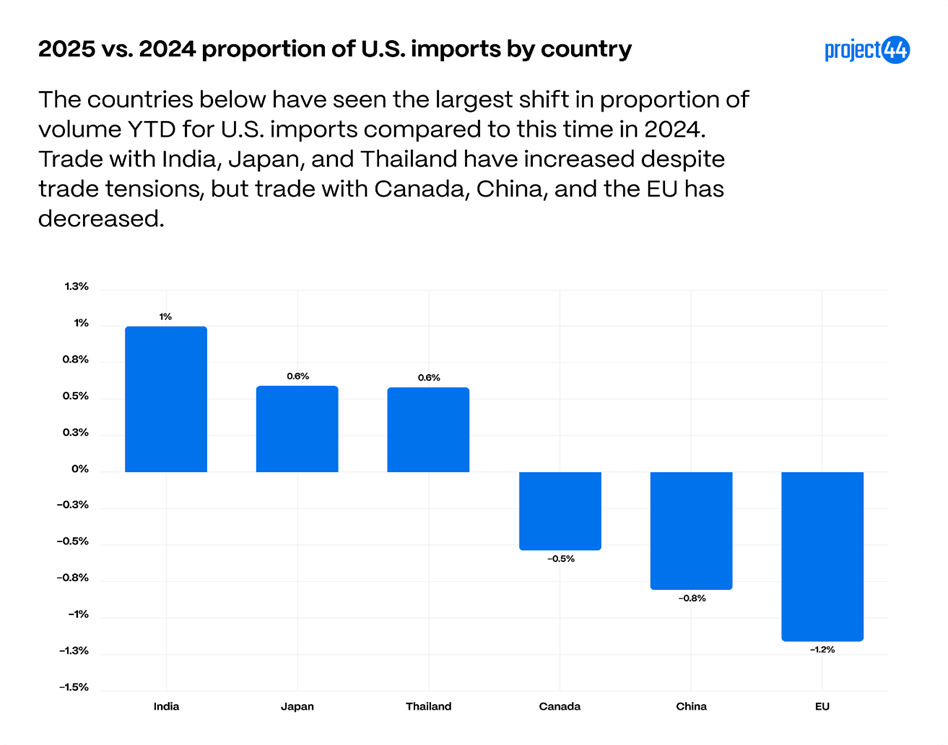
For imports, changes have been modest overall. India has recorded the largest year-over-year increase in share (+1.2%), followed by Japan (+0.6%) and Thailand (+0.6%), while the EU (-1.2%), China (-0.8%), and Canada (-0.5%) have all seen small declines. October does mark the first month that China has landed in the top 3 decreases to US import proportion, showing the impacts of aggressive tariffs and an industry push to diversify suppliers away from China. Chinese imports are down, both proportionally and by volume as observed in the charts above.
Impacts of the end of de minimis exemption
The de minimis exemption allowed packages entering the United States with a value of less than $800 to be exempt from tariffs and duties. This exemption was closed as of August 29, 2025, so now all items entering the US are subject to tariffs and duties regardless of value. Shippers, like USPS, UPS, and FedEx are responsible for collecting these taxes, and charge broker fees to cover processing costs and labor needed to manage this process. This has led to an uptick in consumers in the US being surprised by a tariff bill after a package was delivered and has created a need for an average consumer to have a higher awareness for where online orders are shipping from and what tariffs and duties they might incur.
This has also led to an increase in work needed for eCommerce shippers to process shipments from overseas, with concerns that this will delay online orders in the eCommerce space.
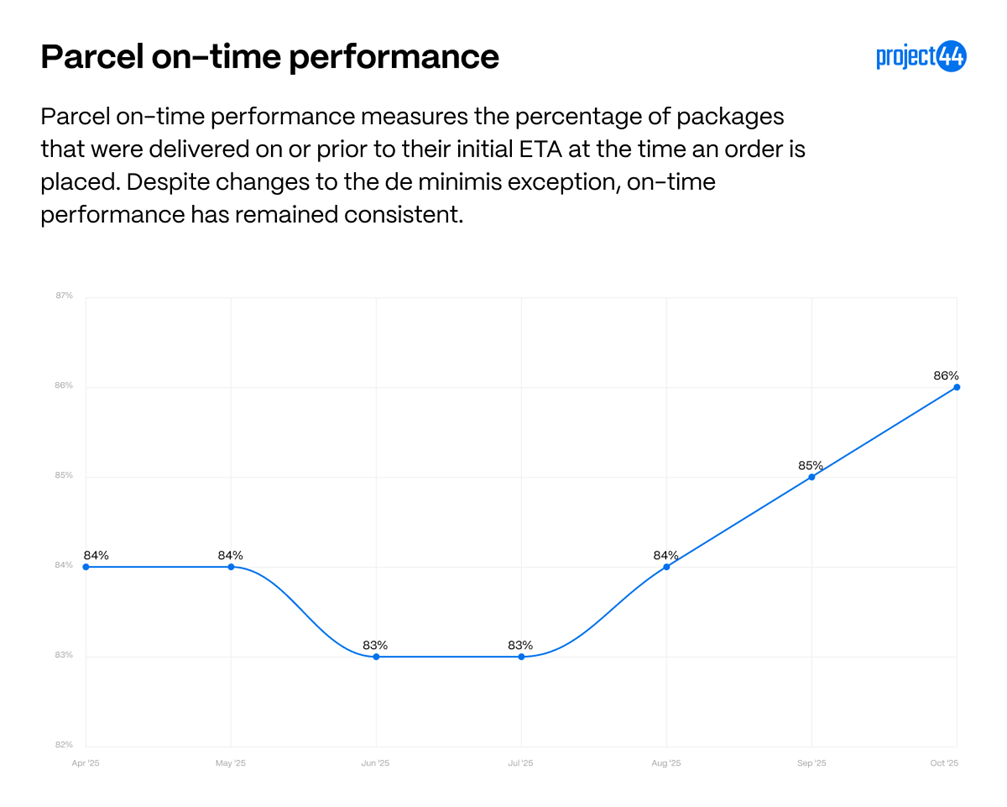
Despite the end of de minimis, last-mile on-time performance improved by 2% between August and October. This does not mean packages aren’t facing delays due to the extra paperwork and processing required for imports, but rather reflects that many retailers fulfill eCommerce orders domestically. Major retailers often import in bulk, stock fulfillment centers, and ship domestically, so most online orders in the US are unaffected.
However, consumers should be aware of a package’s origin, as items shipped directly from overseas remain subject to tariffs, duties, and potential delays.
Starting in November, on-time performance will start to decrease, but that is a seasonal result of parcel peak season, which runs from November-January as holiday shopping picks up.
Appendix
These charts are made to serve as a baseline to fully understand the scope of tariffs and shifting trade dynamics. According to data from the millions of shipments managed annually by project44, the United States primarily imports goods from the following top countries by volume:

China, which is included in the BRICS category, is our largest provider of imports, followed by the EU and Vietnam. These three regions make up more than 50% of the imports tracked by project44 in 2024.
Below are the countries that see the most American exports based off project44 data.
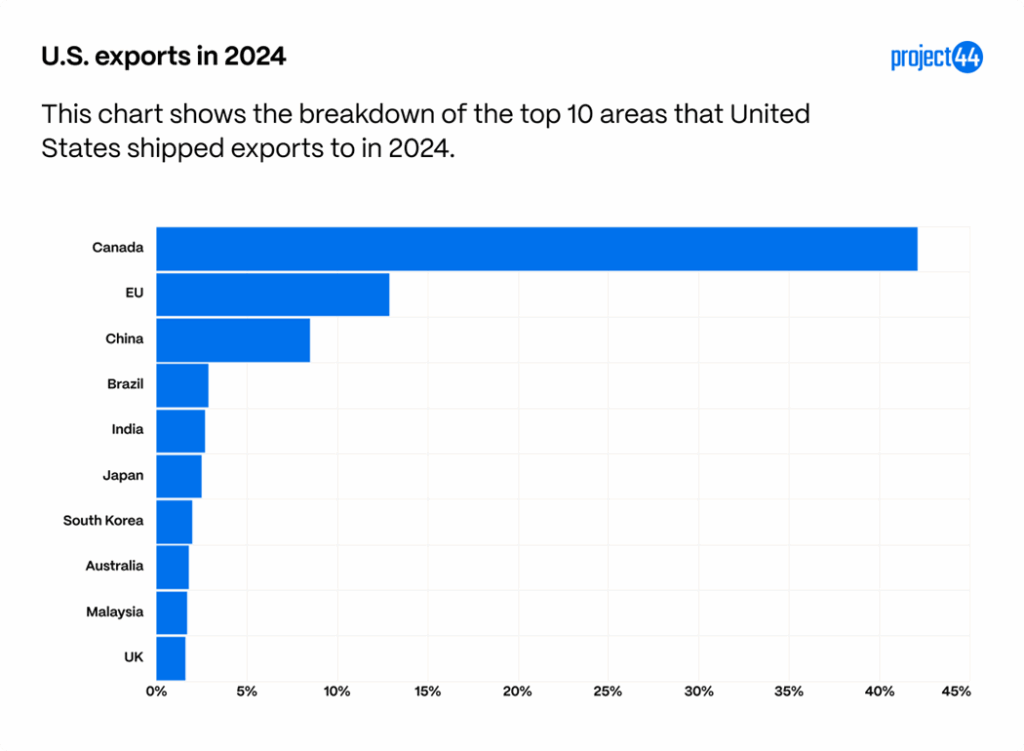
With China separated from the BRICS nations, they receive 8.5% of exports, meaning Canada, China, and the EU make up more than half of the shipments exported from the United States in 2024.
Summary
The 2025 tariff environment has created major volatility in US trade, with blank sailings climbing sharply and trade between the US and China reaching record lows. Imports from China are down 27% year-to-date and exports are down 42%. Capacity reductions are concentrated on key routes, including a 186% rise in blank sailings from the US East Coast to South Asia and a 60% increase from the US West Coast to Europe. At the same time, imports from Thailand and Indonesia have surged more than 30%, while exports to India and Mexico have grown modestly as companies diversify their trade partners. The end of the de minimis exemption added new processing burdens for carriers and consumers, but last-mile performance remained steady through October. Overall, tariffs, capacity cuts, and shifting trade relationships are reshaping global shipping patterns and prompting gradual changes in US sourcing strategies.