

Summary:
- For the first time in 2025, December marks an increase in US exports to China compared to 2024. This comes just two months after a trade discussion between the two countries. However, US imports from China remain lower than 2024 rates.
- Blank sailings on key U.S. trade lanes are down 53% compared to their annual peak in April once “Liberation Day” tariffs were announced. However, there was a 35% increase compared to blank sailings in November, showing there is still volatility in sailing schedules.
- Blank sailings on China–U.S. and Asia–U.S. routes are down versus December 2024, except for Asia to the US, which is up 69% from 2024. This could be tied to recent tariff announcements from Mexico on numerous Asian countries.
- Thailand saw its second consecutive decline in December (-6%) but is still trending at a 28% increase in 2025 compared to 2024. Indonesia continued to see increases compared to December 2024 (+38%) and is up 34% overall in 2025.
Overview
The tariff landscape in 2025 has been shaped by the sweeping overhaul introduced on April 2, known by the current administration as “Liberation Day.” The United States imposed a flat 10% tariff on nearly all imported goods while raising duties on strategic sectors such as steel, aluminum, autos and auto parts under Section 232. Some auto related categories now face tariffs of 25%, and the use of the International Emergency Economic Powers Act broadened coverage even further with certain products carrying total tariff burdens above 40%. These changes triggered immediate supply chain disruptions, increasing costs and prompting companies to reassess sourcing strategies, pricing and inventory management.
As the year progressed, the market began to absorb the initial tariff-driven shocks and move toward a more stable environment. Blank sailings on key U.S. trade lanes fell 53% from their April peak, signaling a normalization in carrier schedules as capacity realigned with demand. U.S. imports from China and exports to China remained well below prior-year levels, though exports showed late-year improvement, with November posting the smallest year-over-year decline since January and December marking the first positive month of growth in 2025. At the same time, sourcing strategies continued to evolve, with Indonesia and Thailand emerging as alternatives, although Thailand imports declined for two consecutive months, pointing to potential demand softness rather than a shift away from the country.
Despite these signs of stabilization, uncertainty persists. A major Supreme Court case will determine whether the administration’s expansive use of tariff authority is constitutional, and several large importers have filed lawsuits seeking refunds for duties they contend were improperly applied. Diplomatic negotiations have provided selective relief for allies, yet the flat 10% tariff and additional sector-based surcharges largely remain intact. With policy outcomes still unresolved, shipping patterns may continue normalizing for now, but the broader legal and regulatory landscape leaves the door open for renewed volatility.
Blank sailings data shows normalization in sailing schedules
In 2025, blank sailings data illustrates how carriers are responding to tariff-driven disruption in US trade. The chart below outlines the total number of blank sailings per month on major U.S. trade lanes (Asia-U.S., China-U.S., Europe-U.S.) that have been most impacted by the tariffs.
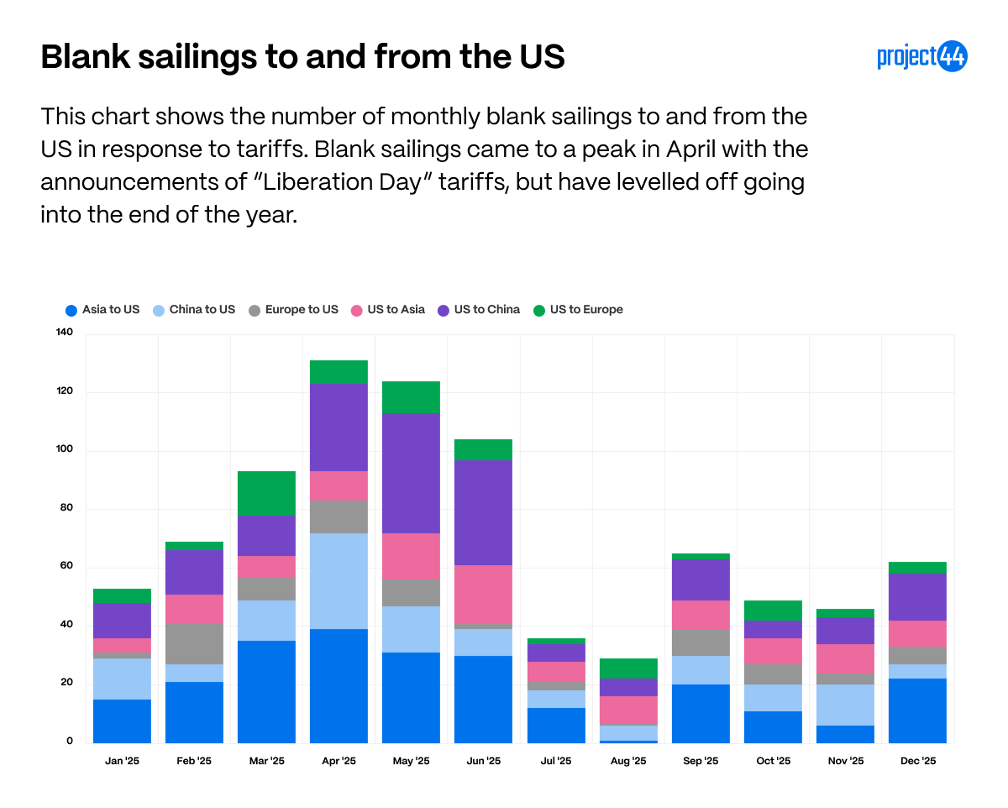
April 2025 marks the peak in blank sailings at a total of 131 blank sailings across these 6 routes. The lanes with the most blank sailings that month were Asia to the U.S. at 39, China to the U.S. at 33, and the U.S. to China at 30. These three lanes have had the highest rates of blank sailings throughout the year.
December 2025 saw a 53% decrease in blank sailings compared to the peak in April, with a total of 62 blank sailings across all 6 routes. This is a 35% increase from November (which had a total of 46 blank sailings), but this rate of blank sailings is considered normal, and it demonstrates that sailing schedules have normalized compared to the tumultuous months observed earlier in 2025.
In December, Asia to the U.S. has the highest rate at 22 blank sailings, with the U.S. to China at 16 and the U.S. to Asia at 9. The chart below looks at how these numbers compare to December 2024.
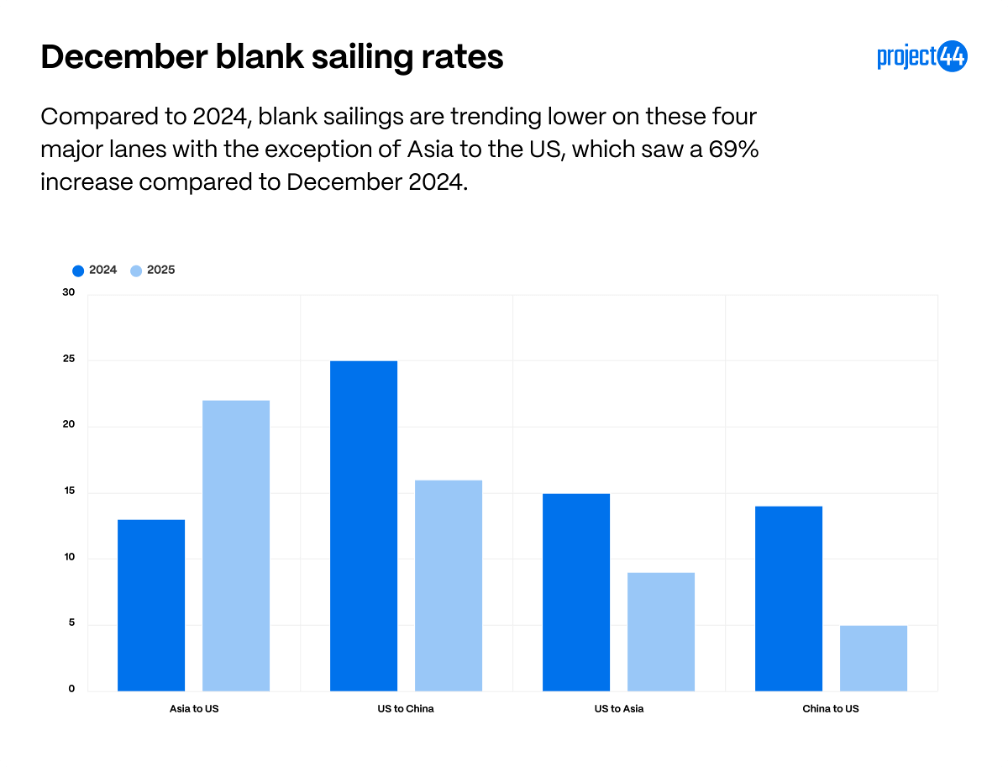
Here, we can see that the overall blank sailing rates in November on these lanes is in better shape than it has been in previous years for China to the U.S. (-64%), U.S. to Asia (-40%), and U.S. to China (-36%).
Asia to the U.S. is the exception here, as it saw a 69% increase compared to 2024, a total of 9 more blank sailings than December 2024. A driving factor here could be the recent tariffs on numerous Asian countries that Mexico has announced starting January 2026, which will continue to pull demand from these trade routes.
US trends in trade partners shift
While tariffs on major trade partner China have been reduced in recent months, their effects continue to ripple through supply chains. A closer look at US/China trade flows in 2025 reveals sharp swings tied directly to tariff actions and market anticipation.
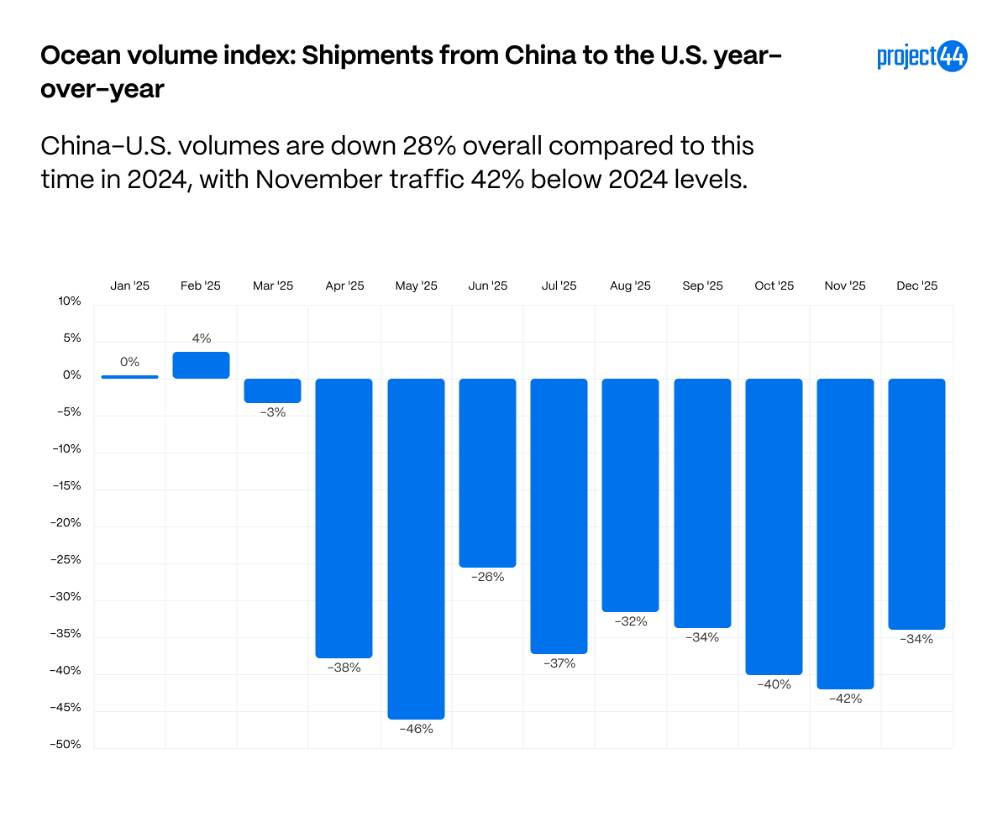
On the import side, shipments from China to the US are trending 34% lower through December compared to 2024, with overall volumes being 28% lower in 2025 compared to 2024. These swings illustrate how tariffs and front-loading behavior created early-year increases followed by sustained weakness through the summer and fall. Despite falling imports from China to the U.S., China’s trade surplus has hit $1 trillion for the first time, showing that China has strengthened trade relations with other countries and is not dependent on the U.S. for their exports.
In response to the US tariffs, China passed their own tariffs on US goods, impacting exports from the US to China.
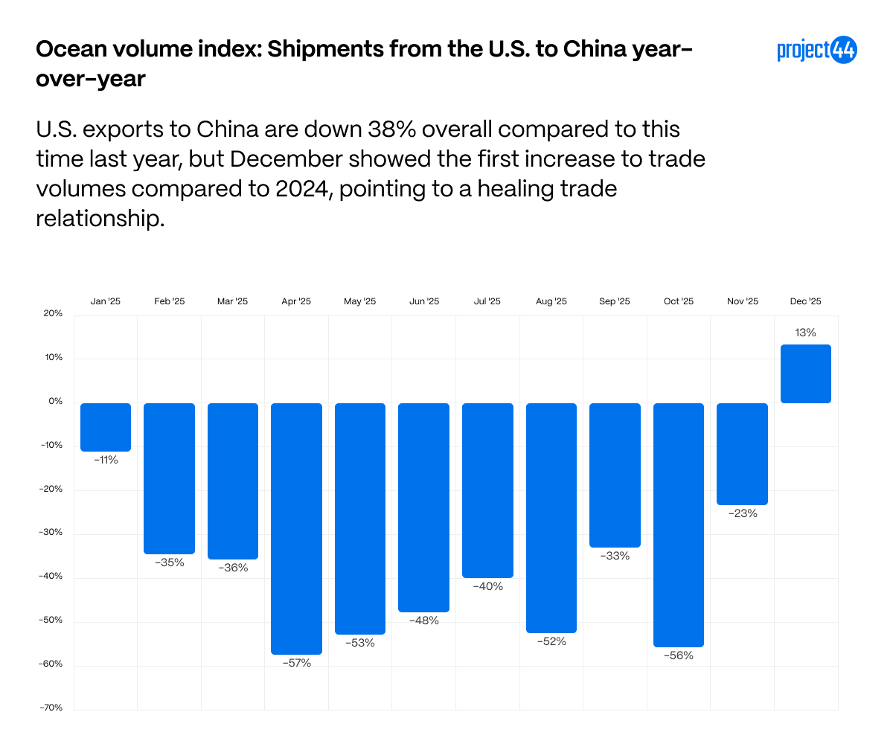
On the export side, shipments from the US to China are under even greater pressure, trending 38% lower year-to-date. Despite a low year for US imports into China, November showed the smallest decrease compared to 2024 since January, at just 23% lower than November 2024, and December had an increase of 13% compared to 2025 marking the first positive month for US exports to China in 2025. Trump and Xi did have a meeting at the end of October about a tentative trade deal, which appears to have helped stimulate US exports, though meaningful differences in US imports from China from this discussion have yet to be observed.
It is abundantly clear that the new tariffs passed by both countries have had major impacts on demand for goods along these lanes. With the decrease of U.S. imports from China, new sourcing strategies are beginning to emerge for U.S. imports.
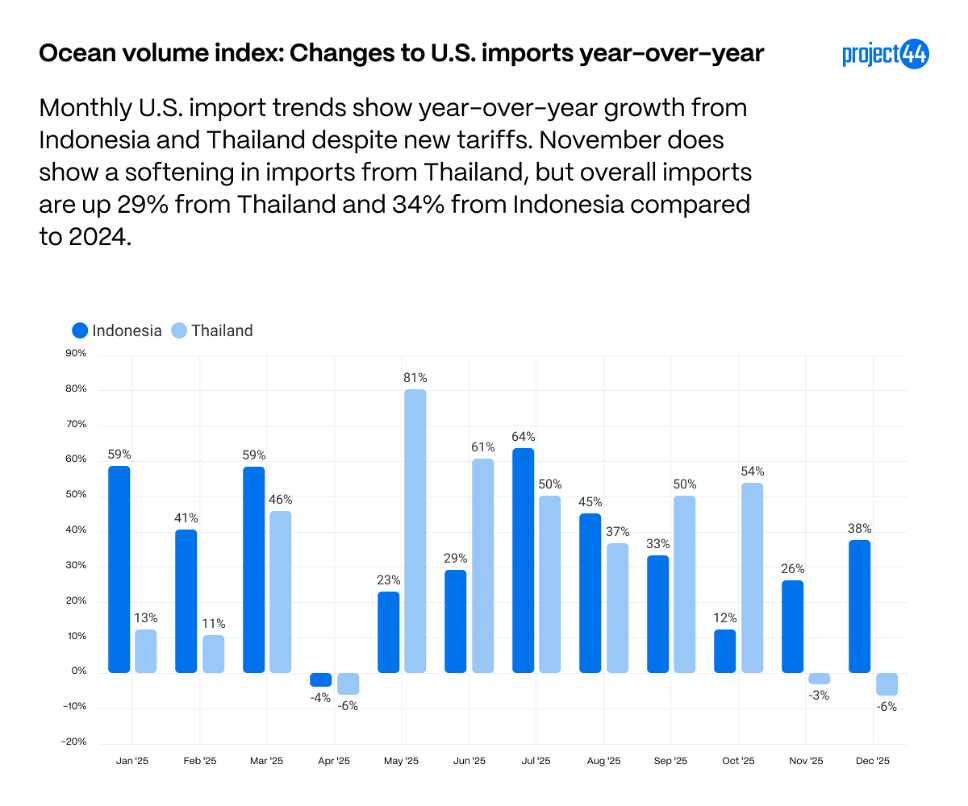
With volumes out of China decreasing, Indonesia and Thailand are emerging as alternative suppliers, with imports up 29% from Thailand and 34% from Indonesia compared to 2024. Both countries still face tariffs (+19% since January, plus product-specific surcharges), but demand has nevertheless grown throughout 2025.
Despite overall growth throughout the year, April marked a decrease from both countries considering the “Liberation Day” tariff announcements, and both November and December show decreases on imports from Thailand compared to 2024. It does appear that Indonesia is emerging as a “winner” from a strategic sourcing standpoint, but with Thailand being the source of many consumer goods popular for the holiday seasons, the recent two months could be more reflective of a softening in consumer demand for their main imports rather than companies strategically deciding to focus on other countries for sourcing.
Appendix
These charts are made to serve as a baseline to fully understand the scope of tariffs and shifting trade dynamics. According to data from the millions of shipments managed annually by project44, the United States primarily imports goods from the following top countries by volume:
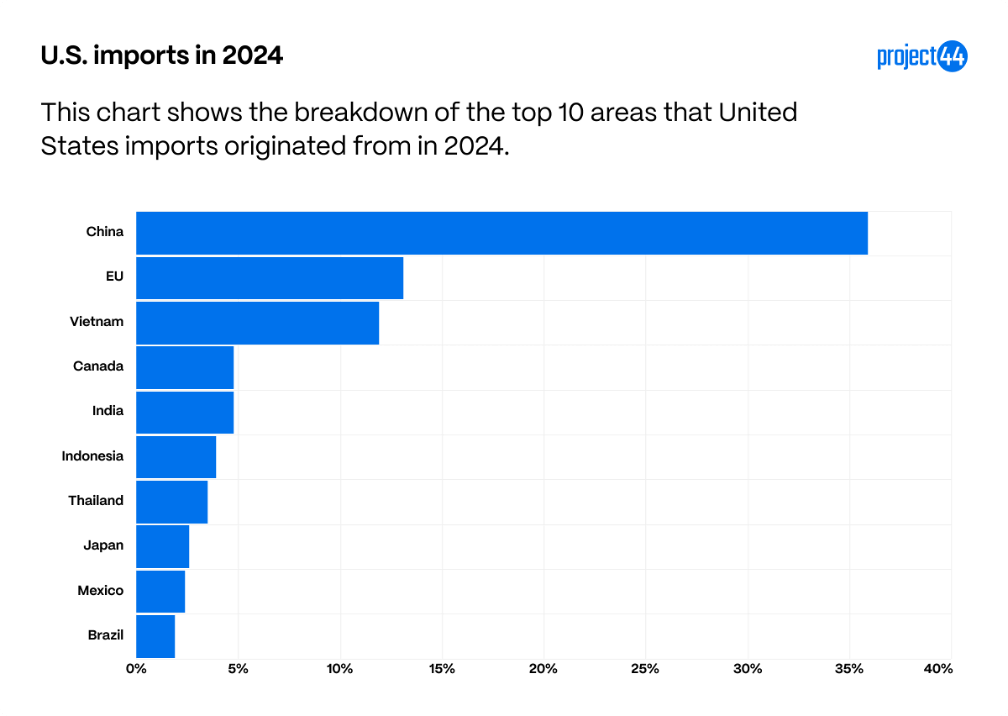
China, which is included in the BRICS category, is our largest provider of imports, followed by the EU and Vietnam. These three regions make up more than 50% of the imports tracked by project44 in 2024.
Below are the countries that see the most American exports based off project44 data.
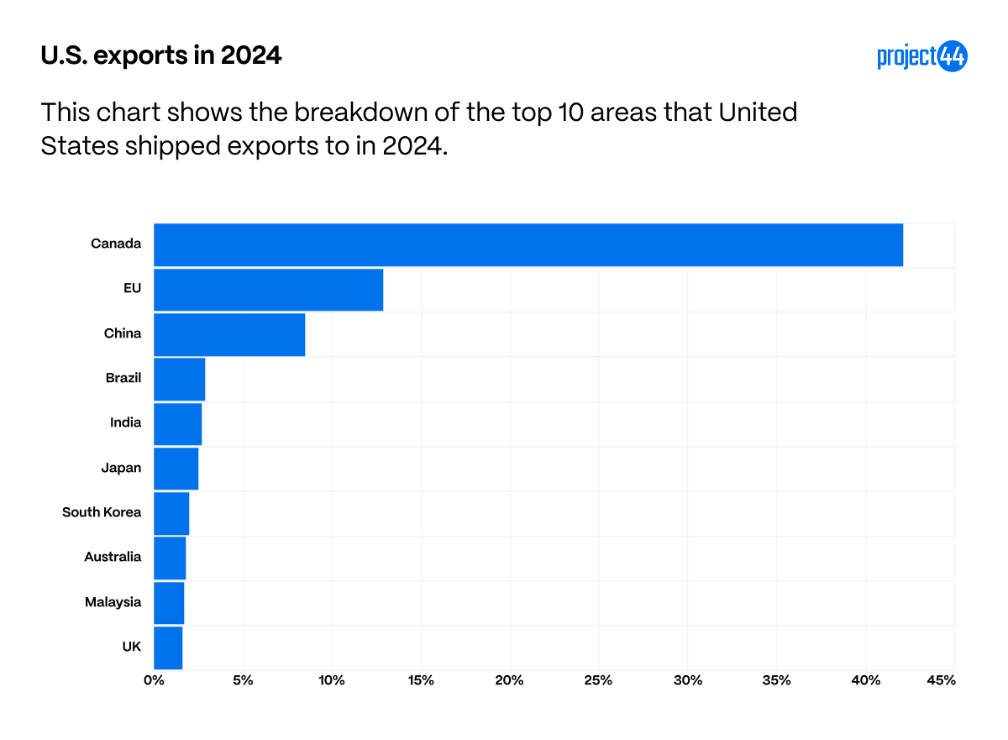
With China separated from the BRICS nations, they receive 8.5% of exports, meaning Canada, China, and the EU make up more than half of the shipments exported from the United States in 2024.
Summary
Overall, the data shows that while 2025 began with elevated volatility driven by tariff activity and front-loaded demand, conditions have begun to stabilize toward the end of the year. Blank sailings peaked in April as carriers adjusted capacity in response to uncertainty, but by December sailing schedules had largely normalized, signaling a return to more balanced supply and demand conditions despite some month-over-month variability. At the same time, tariffs have continued to materially reshape trade flows, with U.S. imports from China and U.S. exports to China both trending meaningfully lower year over year, even as late-year trade discussions appear to have supported modest export improvement. As volumes out of China decline, alternative sourcing strategies are becoming more established, with Southeast Asian countries such as Indonesia and Thailand absorbing a portion of displaced demand.
Taken together, these trends suggest the market has moved out of its most disruptive phase and into a new operating environment, where carrier networks, trade flows, and sourcing strategies are adjusting to a tariff-driven baseline rather than temporary disruption. However, with the looming Supreme Court decision on IEEPA tariffs, it is possible that this new normal will readjust once again based on the outcome.