Summary:
- Week 10 (3,788) and Week 11 (3,718) are the two lowest weeks of the disruption. Week 11 is down 1.8 percent on Week 10, the smallest week-over-week change of the 11-week period.
- Import dwell at Jebel Ali sat at 52.53 days in Week 11, 6.6 times its pre-conflict baseline of 7.95 days, and remains the most pressured port in the dataset across all 11 weeks.
- Two Turkish ports (Iskenderun at 24.28 days and Mersin at 21.91 days) and two Indian ports (Ennore at 16.85 days and Hazira at 15.08 days) have entered the top 6 most-pressured import ports by Week 11, signaling that congestion is now spreading beyond the Gulf region.
- Export dwell at Abu Dhabi reached 69.27 days in Week 11, more than 5 times its pre-conflict baseline of 13.17 days, and at Jebel Ali stood at 59.54 days versus a 17.16-day baseline. Outbound flow from UAE ports is significantly more constrained than inbound flow.
- The top diversion lane in Week 11 is Dubai (Jebel Ali) to Khawr Fakkan with 526 shipments, followed by Jeddah to Salalah (355) and Salalah to Jeddah (195). These three lanes alone accounted for 29 percent of Week 11 diversions.
- Cape of Good Hope routing remains elevated. Durban handled 76,151 TEU in arrivals and 72,336 TEU in departures in Week 11, with both well above its pre-conflict weekly averages of 56,272 and 53,930 TEU respectively.
- Gwadar (Pakistan) shows signs of emerging as an overflow port, with 3 vessel calls observed between April 19 and April 30 totaling 645 TEU of movements. The port had no comparable activity in the pre-conflict baseline period and warrants further monitoring.
Overview
Eleven weeks into the Strait of Hormuz disruption, the network has settled into a more durable phase. Diversion volumes have come down from the Week 4 peak of 9,572 shipments to 3,718 in Week 11, a contraction of 61 percent, but the latest two weeks remain well above the pre-conflict baseline. The week-over-week change between Week 10 and Week 11 is negative 1.8 percent, the smallest movement of the entire 11-week period and a clear signal that the rerouting work has largely been absorbed.
However, easing diversions have not translated into easing congestion. Import dwell at the most pressured ports continues to climb, with Jebel Ali, Mersin, and Iskenderun all sitting at or near their post-disruption highs in Week 11. Export dwell, particularly at UAE ports, is significantly more elevated than import dwell, suggesting that outbound flow remains the binding constraint.
The longer-haul rerouting around the Cape of Good Hope remains active. Durban in particular continues to handle weekly TEU volumes well above its pre-conflict baseline, indicating that carriers continue to treat the Africa route as a structural option rather than a short-term workaround.
Weekly diversions reach their lowest level of the disruption
Weekly diversion volumes peaked at 9,572 shipments in Week 4 and have stepped down materially since. The chart below shows the full 11-week trajectory.
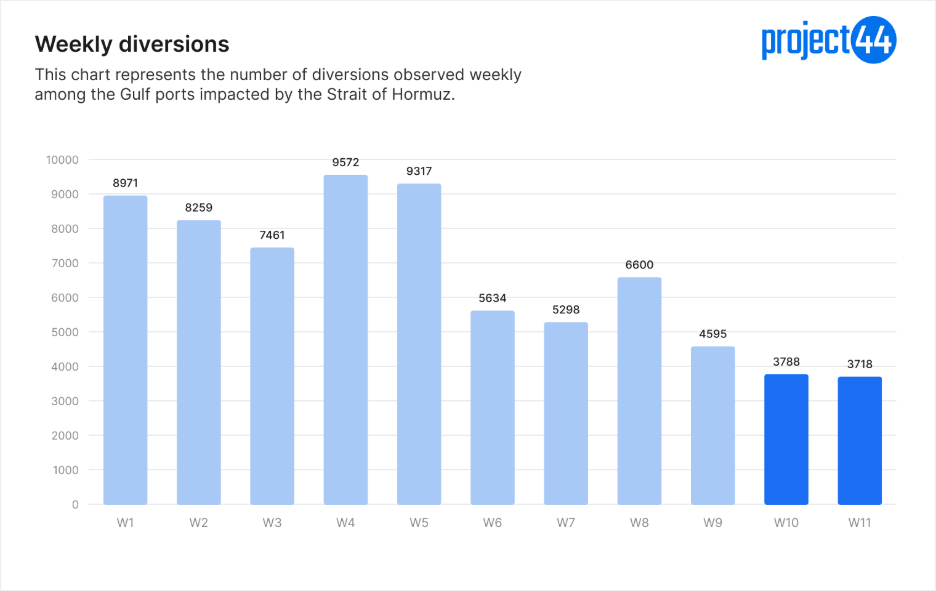
Week 10 recorded 3,788 diversions and Week 11 recorded 3,718, a week-over-week change of negative 1.8 percent. This is the smallest week-over-week movement of the entire disruption. Earlier weeks produced swings ranging from positive 28.3 percent (Week 4 versus Week 3) to negative 39.5 percent (Week 6 versus Week 5).
The flatness between Week 10 and Week 11 suggests carriers have largely completed their rerouting work and are now operating within revised routing structures rather than reacting to fresh disruption.
Import dwell remains elevated and is spreading beyond the Gulf
Ranked by Week 11 import dwell, the six most pressured ports include Jebel Ali in the UAE, two Turkish ports (Iskenderun and Mersin), and three Indian ports (Ennore, Hazira, and Navi Mumbai). The geographic spread of this list, with secondary congestion now visible in Turkey and India, indicates that the disruption has propagated well beyond the immediate Gulf region.
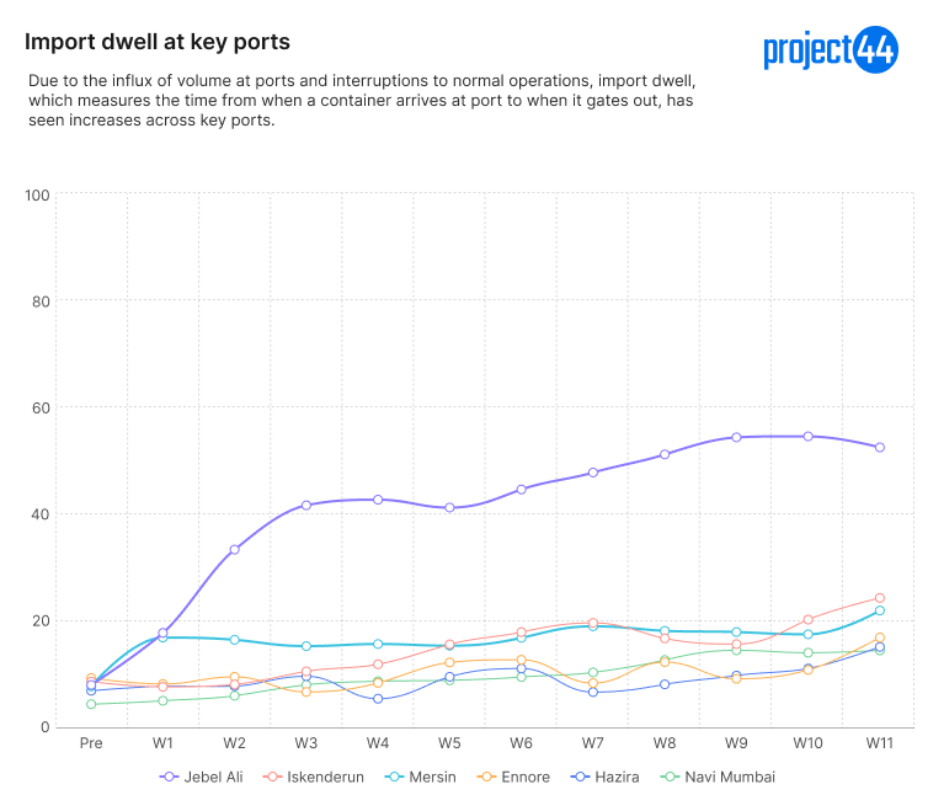
Jebel Ali remains the single most pressured port. Import dwell sat at 54.60 days in Week 10 and eased modestly to 52.53 days in Week 11. Even with this slight relief, Jebel Ali is operating at 6.6 times its pre-conflict baseline of 7.95 days.
The Turkish ports show the most acute Week 11 jumps. Iskenderun climbed from 20.21 days in Week 10 to 24.28 days in Week 11, the largest single-week increase in the top 6. Mersin moved from 17.45 days to 21.91 days over the same period. Both ports were operating at well under 10 days pre-conflict.
The three Indian ports tell a more mixed story. Ennore moved from 10.76 days in Week 10 to 16.85 days in Week 11, a sharp single-week jump. Hazira rose from 11.03 days to 15.08 days. Navi Mumbai held effectively flat at 14.43 days, broadly in line with its Week 9 peak of 14.44.
Export dwell is the binding constraint at UAE ports
Export dwell is materially more elevated than import dwell at the most pressured ports. The chart below shows the top 6 ports ranked by Week 11 export dwell.
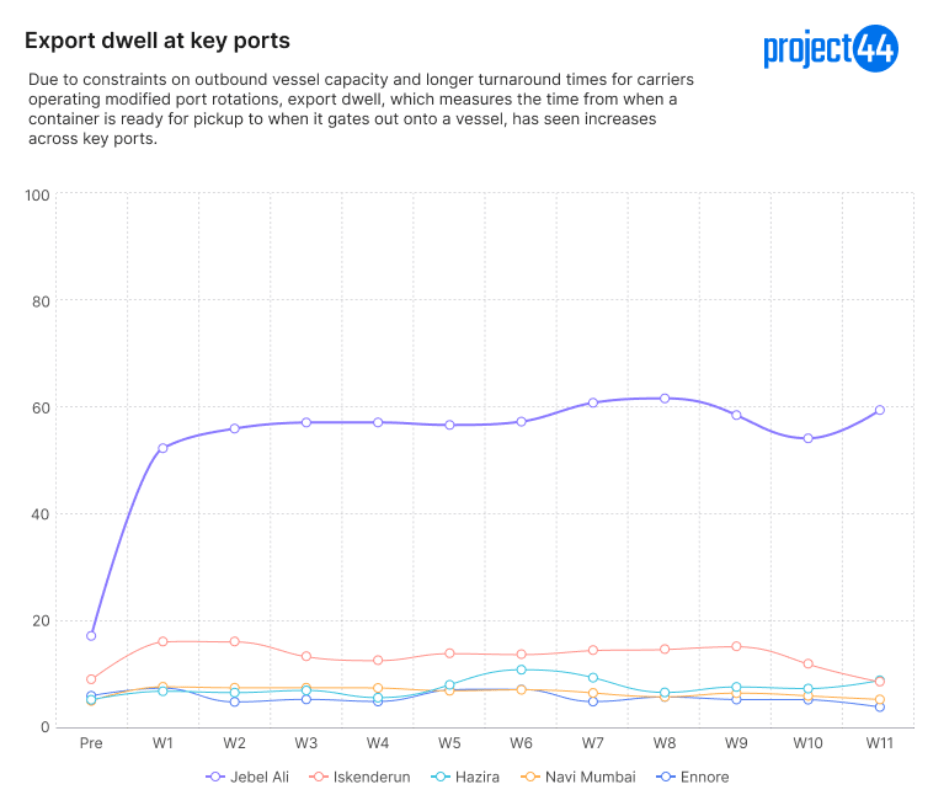
Jebel Ali stands alone. Export dwell sat at 59.54 days in Week 11, 3.5 times its pre-conflict baseline of 17.16 days, and has held above 50 days for every week since Week 1. This is the same pattern visible on the import side, but more entrenched: outbound flow has been continuously constrained since the disruption began.
Hazira is the only other port in this set running clearly above its pre-conflict baseline, at 8.81 days in Week 11 versus a 5.17-day pre-conflict average (1.7 times baseline). Iskenderun, Navi Mumbai, and Ennore are each at or below their pre-conflict export dwell figures in Week 11 (Iskenderun 8.59 vs 9.02 pre, Navi Mumbai 5.23 vs 4.96 pre, Ennore 3.81 vs 5.92 pre).
Top diversion lanes in Week 11
Diversion volumes are concentrated in a small number of intra-regional lanes. The top 10 lanes by Week 11 shipments account for 47.8% of all Week 11 diversions, with the single largest lane alone (cargo originally bound for Jebel Ali rerouted to Khawr Fakkan) carrying 14.1% of the week’s total. Each lane reads as Original destination → New destination, so a Jeddah → Salalah entry means cargo originally bound for Jeddah was rerouted to Salalah.
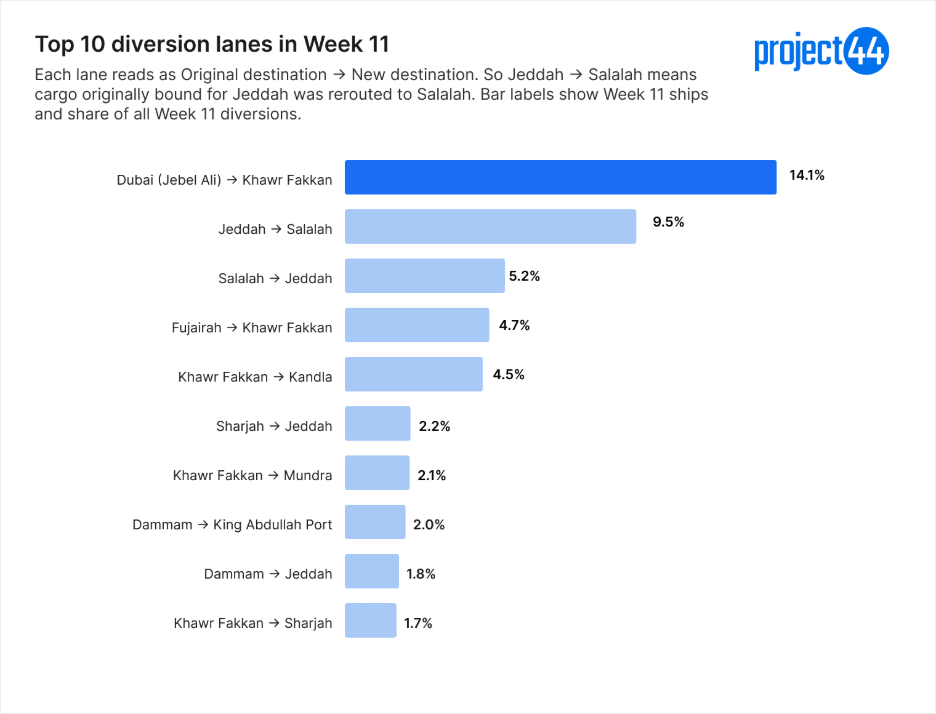
The single largest reroute in Week 11 was cargo originally destined for Jebel Ali that was redirected to Khawr Fakkan, accounting for 14.1% of all Week 11 diversions. This Jebel Ali → Khawr Fakkan substitution is also the largest cumulatively across the disruption. The pattern points to Khawr Fakkan functioning as the de-facto alternative discharge port whenever Jebel Ali is congested.
A Red Sea substitution pattern shows up clearly in lanes two and three. In Week 11, cargo originally bound for Jeddah was rerouted to Salalah on 9.5% of all diversions, and cargo originally bound for Salalah was rerouted to Jeddah on a further 5.2%. Both Jeddah → Salalah and Salalah → Jeddah lanes have small cumulative footprints across the 11-week disruption, suggesting these are recent substitutions tied to the disruption rather than long-standing flows.
Two newer reroutes emerged late in the disruption. Cargo originally bound for Khawr Fakkan was redirected to Kandla on 4.5% of Week 11 diversions, which is also the full 11-week total for this Khawr Fakkan → Kandla lane (it had no observable activity in earlier weeks). A similar late emergence shows up for Sharjah → Jeddah at 2.2% of Week 11 diversions, with nearly all of its 11-week cumulative activity occurring in Week 11.
Cape of Good Hope rerouting remains active
The longer-haul rerouting around Africa remains a meaningful feature of the disrupted network 11 weeks in. The chart below shows weekly arrivals and departures across the five monitored Cape ports.
Durban is doing the heaviest lifting. The port handled 76,151 TEU in arrivals in Week 11, 35 percent above its pre-conflict weekly average of 56,272 TEU. Departures stood at 72,336 TEU, 34 percent above the 53,930 TEU pre-conflict average. Cape Town came in at 40,426 TEU arrivals (23 percent above its 32,858 baseline) and 39,014 TEU departures (19 percent above its 32,722 baseline).
Walvis Bay and Port Elizabeth show more volatile week-to-week patterns. Walvis Bay handled 31,584 TEU arrivals in Week 11 (broadly in line with its 30,024 baseline) and 36,372 TEU departures (17 percent above its 31,126 baseline). Port Elizabeth fell back to 8,685 TEU arrivals in Week 11 after recording a 46,865 TEU spike in Week 6.
Maputo has remained roughly in line with pre-conflict levels throughout the disruption, handling 5,973 TEU arrivals and 6,073 TEU departures in Week 11. The combined picture across the five Cape ports indicates that the Africa route is absorbing meaningful additional volume relative to pre-conflict baselines, but the concentration of that volume sits with Durban and to a lesser extent Cape Town.