Strong demand for container shipping space on major trade lanes from Asia to Europe and North America saw cargo rollovers increase month-on-month in October as carriers struggled to keep ocean supply chains operating smoothly.
Overall container rollover ratios at leading transshipment ports rose to 28.5% in October, up from 26.9% in September and 22.2% in October 2019, according to project44, the world’s leading real-time and predictive ocean container tracking data provider to forwarders and shippers.
“This is supposed to be container shipping’s seasonal lull after the summer peak season, but on some trade lanes freight rates are near record levels and ships are still departing Asia full,” said Josh Brazil, at project44.
“Container lines are trying their best to cope with critical box shortages in Asia but this is putting more pressure on operations and freight rates. Carriers also no longer have the option of adding more vessels to boost capacity – almost the entire global fleet is currently active.”
“I think what we are seeing is that the cargo pipeline has maxed out ocean supply chain capacity and this is being reflected in heightened rollover levels which translates into more disruption for shippers and forwarders.”
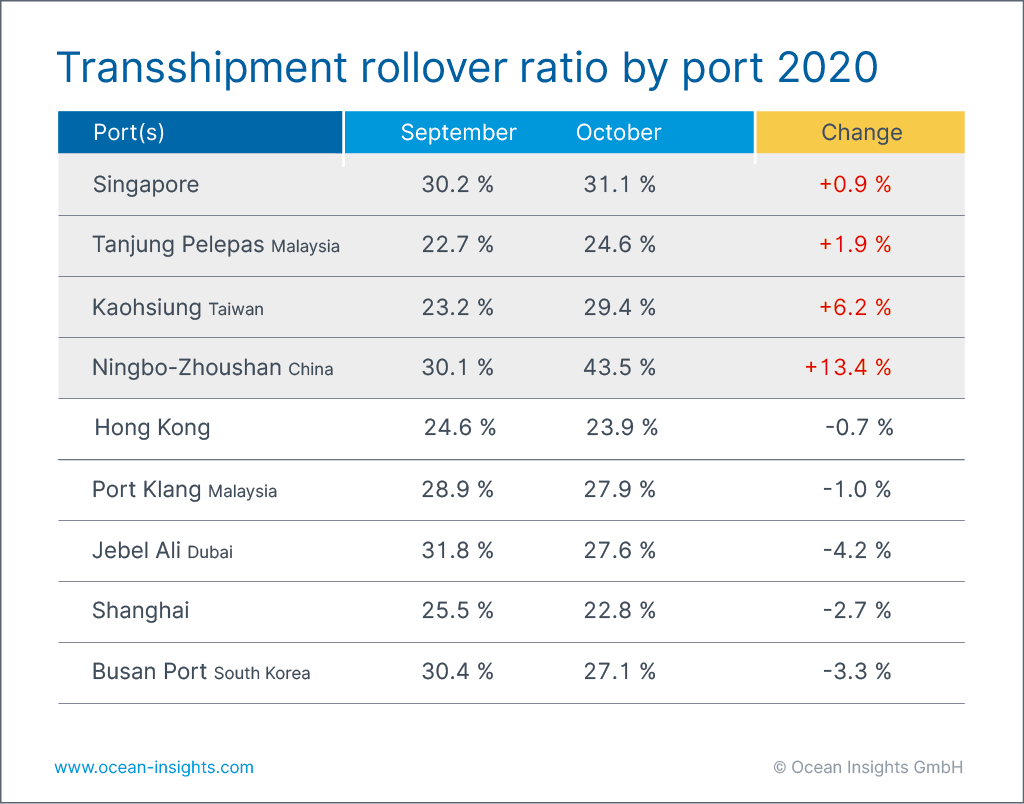
Rollover Ratios By Major Port Hubs
Singapore, the world’s second-largest container hub, saw its rollover ratio, calculated by project44 as the percentage of cargo arriving at the port for transshipment that was shipped on a different vessel than originally scheduled, increase to 31.1% in October from 30.2% in September. This compared to just 21.6% of cargo rolled in October 2019.
The Port of Tanjung Pelepas in Malaysia saw 24.6% of cargo rolled in October, up from 22.7% a month earlier, while Taiwan’s Kaohsiung saw its rollover ratio last month rise to 29.4% from 23.2% a month earlier.
Ningbo-Zhoushan, the world’s third-largest container port in 2019 by throughput, was one of the worst performers in October with 43.5% of its cargo rolled, up from 30.1% a month earlier.
“I think what we are seeing is that the cargo pipeline has maxed out ocean supply chain capacity and this is being reflected in heightened rollover levels which translates into more disruption for shippers and forwarders.”
Josh Brazil
project44
However, even though overall cargo rollovers at transshipment ports were up last month, some of the world’s leading box hubs also reported an improvement in carrier adherence to schedules.
24.6% of cargo was rolled at the port of Hong Kong in September but this fell to 23.9% last month but was still higher than the rollover ratio of 21.9% recorded in October 2019.
The Malaysia hub of Port Klang saw 27.9% of cargo rolled last month, down from 28.9% in September and 42.3% in August.
Dubai (Jebel Ali port) saw rollovers drop again last month, down to 27.6% from 31.8% in September and 34.9% in August.
Shanghai, the world’s largest container port, saw its rollover ratio improve to 22.8% last month, from 25.5% in September and 26.5% in August. Busan Port, the world’s sixth largest box hub in 2019, also saw cargo rollovers fall last month, dropping to 27.1% from 30.4% a month earlier.
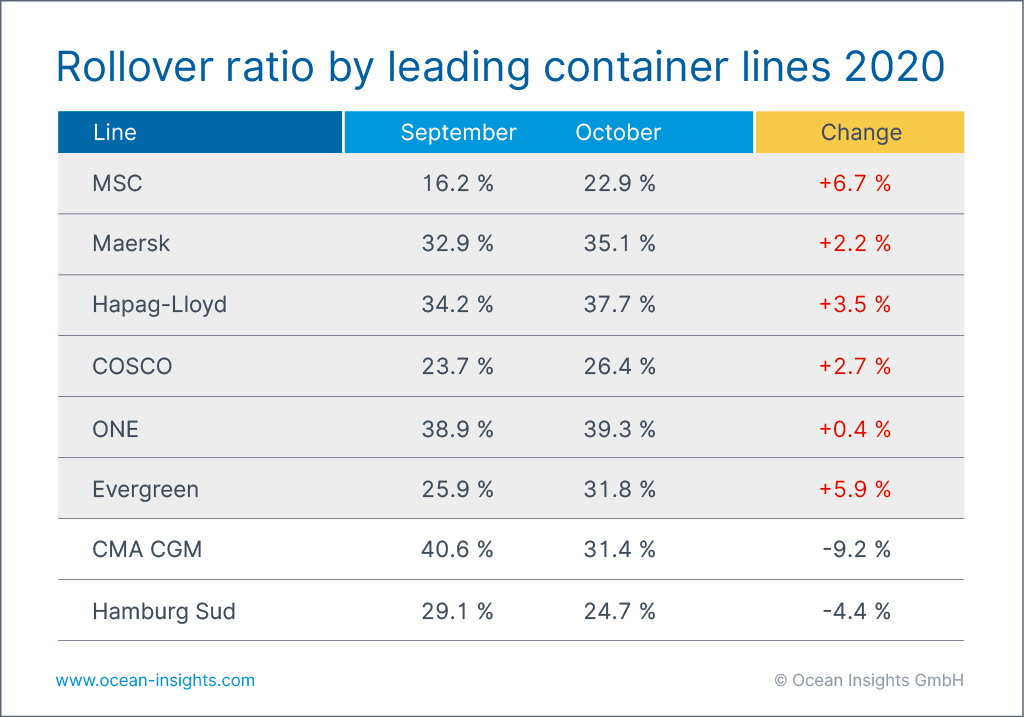
Rollover Ratios By Leading Container Lines
Reflecting the port data, most container lines saw their rollover ratios deteriorate last month. Project44 calculates the rollover ratio for carriers as the percentage of cargo carried by each line globally that left a transshipment port on a different vessel than originally scheduled.
MSC’s rollover ratio as calculated by project44 rose to 22.9% last month from 16.2% in September.
Maersk’s rollover ratio increased to 35.1% last month from 32.9% in September, while Hapag-Lloyd’s rollover ratio crept up to 37.7% in October up from 34.2% a month earlier.
COSCO’s ratio increased to 26.4% last month from 23.7% in September, ONE’s ratio rose to 39.3% from 38.9% over the same period, while Evergreen’s rollover ratio was up to 31.8% last month from 25.9% in September.
Bucking the trend, CMA CGM’s rollover ratio dropped from the substantial 40.6% and 45.8% recorded in September and August, respectively, to 31.4% last month.
Hamburg Sud also saw its performance improve last month with its cargo rollover ratio falling to 24.7% from 29.1% in September.
The latest global container port rollover findings were compiled by analyzing project44’s proprietary global container tracking data through to the end of October.