Summary:
- Trade with two of the top three countries that the U.S. exports to has decreased YTD compared to this time in 2024. Canada makes up 7.6% less of the share of exports leaving the U.S. while China is trending 1% lower than last year.
- Blank sailings surge on key lanes: The New York → Colombo route saw a 49.2 percentage point increase in blank sailings year-over-year, while Lianyungang → Seattle and Kaohsiung → Long Beach rose by 27.0 pp and 22.7 pp, respectively.
- India and Bangladesh have gained trade share with the U.S., continuing multi-year growth trends as companies diversify sourcing. However, trade tensions with India continue to rise, which could end growth patterns.
Overview
The “Liberation Day” tariffs, which went into effect on August 7, 2025, represent the most wide-ranging tariff implementation in modern U.S. history. While sweeping in scope, they are only the latest in a series of tariff measures introduced this year. A wide range of duties—tracked in detail in our tariff tracker—has created an uncertain and often volatile environment for global trade.
One of the clearest indicators of this shifting landscape has been an increase in blank sailings throughout 2025, reflecting reduced demand for ocean capacity as the cost to import goods into the United States rises. These capacity cuts have been concentrated on certain lanes and carriers, particularly on U.S.-related trade routes most directly impacted by tariffs and geopolitical tensions. However, as tariff rates have begun to stabilize, early data suggests that U.S. companies have not made wholesale changes to their trade strategies. The overall proportions of imports and exports remain broadly consistent with 2024 levels year-to-date, indicating that for now, most sourcing patterns remain intact.
Some short-term tactical adjustments are evident. For example, Chinese weekly import volumes show both pull-forward ordering ahead of tariff hikes and delayed shipments when rates were at their peak. Yet on a net basis, U.S. import volumes are comparable to 2024—underscoring that the biggest changes so far have been in the timing of shipments rather than the structure of supply chains.
Longer-term shifts, such as moving manufacturing to other countries or reshoring production to the U.S., remain under close watch. These decisions require significant capital investment and multi-year timelines to execute. Until such changes materialize, the additional costs imposed by tariffs are being absorbed somewhere along the chain—by overseas vendors, U.S. importers, or ultimately, the end consumer.
Blank sailings data indicates shifting trade and capacity management
In 2025, blank sailings data reveals how carriers are responding to the tariff-driven disruption in U.S. trade. Several U.S.-related trade lanes have seen significant increases in blank sailing rates compared to 2024, pointing to tighter capacity control and shifting service priorities.
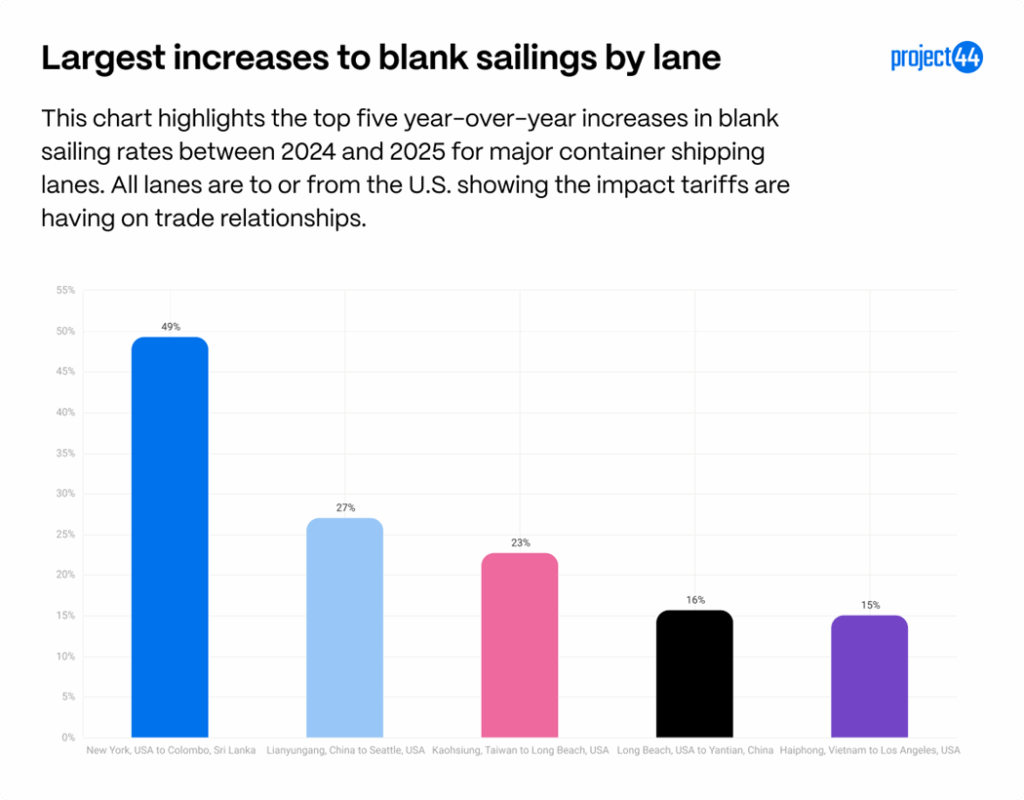
Among the largest year-over-year increases, the New York, USA → Colombo, Sri Lanka route saw a surge of 49.2 percentage points in blank sailings, driven by reduced export demand and geopolitical uncertainty in South Asia. Trans-Pacific lanes such as Lianyungang, China → Seattle, USA (+27.0 pp) and Kaohsiung, Taiwan → Long Beach, USA (+22.7 pp) also posted sharp rises, likely reflecting weaker U.S. import demand from tariff-exposed markets.
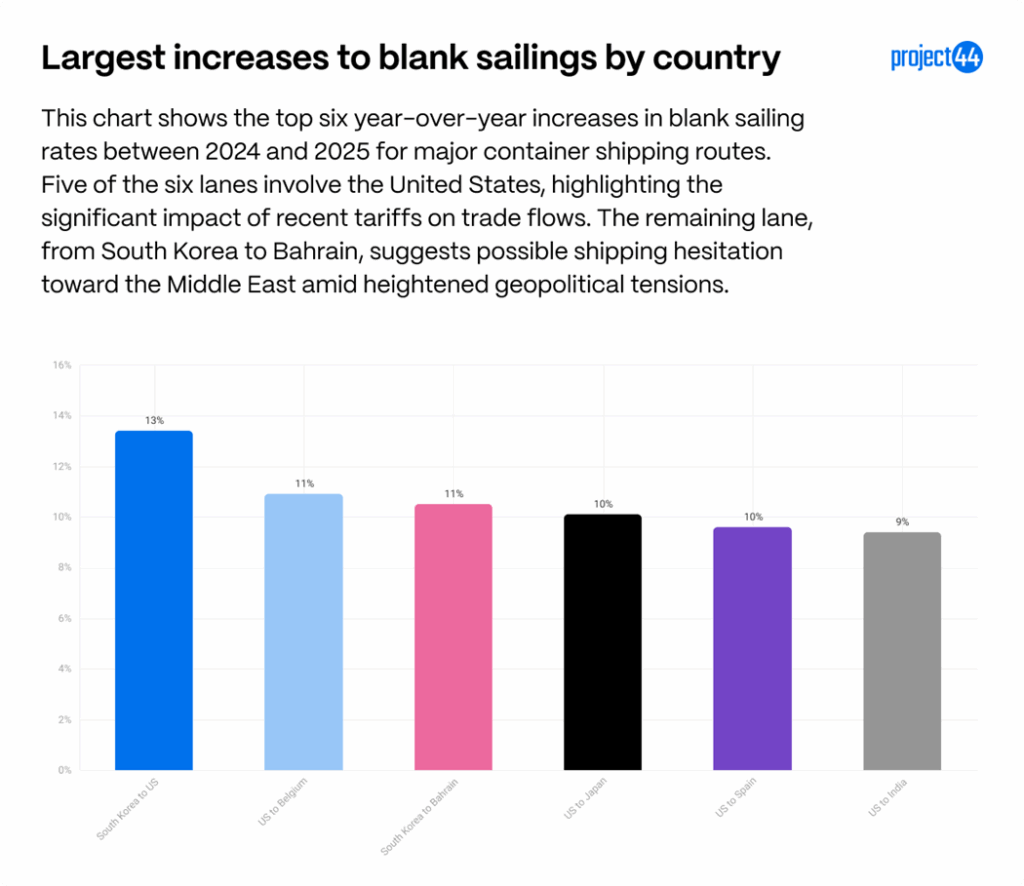
At the country-to-country level, the South Korea → U.S. Lane saw the largest jump, up 13.4 percentage points (from 8.5% to 21.9%), followed by U.S. → Belgium (+10.9 pp, from 14.1% to 25.0%) and South Korea → Bahrain (+10.5 pp, from 13.0% to 23.5%). Other significant movers include U.S. → Japan (+10.1 pp) and U.S. → Spain (+9.6 pp). Many of these routes involve high-value manufactured goods and machinery, sectors that have been directly impacted by the 2025 tariff environment.
This data provides important insights into how tariffs are impacting supply chain movement. Don’t mistake capacity discipline for demand recovery. The spike in blanks on U.S.–linked lanes is carriers managing the chessboard, avoiding high tariffs and reorganizing their importing strategy to align with the changing game,” said Lora Cecere, founder of Supply Chain Insights, LLC.
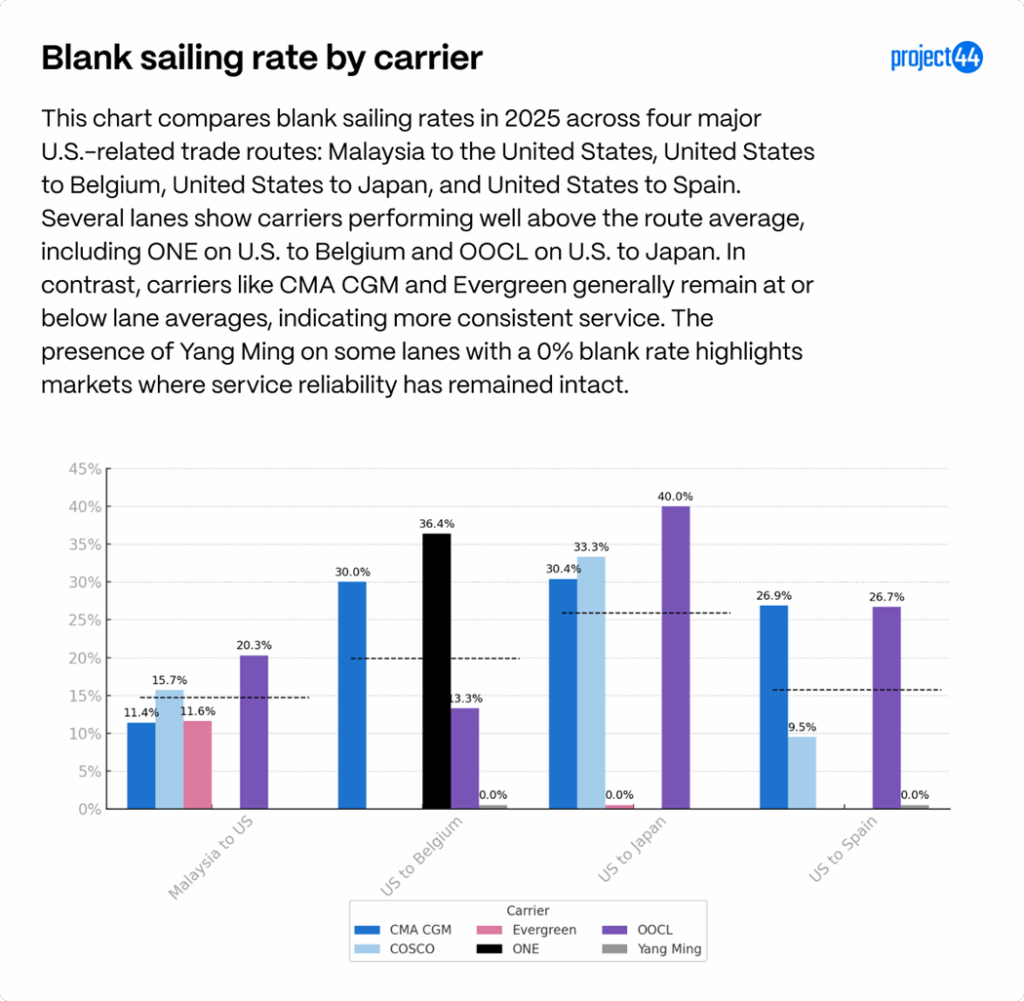
When examining blank sailings by carrier, the differences are striking. In U.S.–Malaysia trade, OOCL’s blank sailing rate reached 20.3%, well above the lane average, while CMA CGM and Evergreen maintained rates near or below average (11–12%). On U.S. export lanes to Europe and Asia, some carriers, such as ONE on U.S. → Belgium (36.4%) and OOCL on U.S. → Japan (40.0%), stand out for operating at rates far above their lane averages, signaling more aggressive capacity management strategies. In contrast, other carriers have preserved more stable schedules, keeping rates well under the lane norm. Of the lanes sampled in this analysis, Evergreen and Yang Ming have the most stable schedules.
Tariff changes lead to rebounding trade with China
While tariffs on major trade partner China have been reduced in recent months, their effects continue to ripple through supply chains. A closer look at U.S.–China trade flows in 2025 reveals sharp swings tied directly to tariff actions and market anticipation.

On the import side, volumes from China began the year at exceptionally high levels—peaking at more than 110% above the same period in 2024. This surge was driven by two factors: the typical post-holiday/Lunar New Year lull in the 2024 baseline, and a significant pull-forward of orders as shippers raced to beat tariff increases. Once higher duties took effect and U.S. inventories swelled, ordering slowed dramatically, falling to as much as 15% below 2024 levels. Import activity has since stabilized following the reduction of tariffs from a peak of 145% in reciprocal tariffs to 10%, though some short-term volatility remains likely until a final trade agreement is secured.
In response to the U.S. tariffs, China passed their own tariffs on U.S. goods, also impacting exports from the U.S. to China.
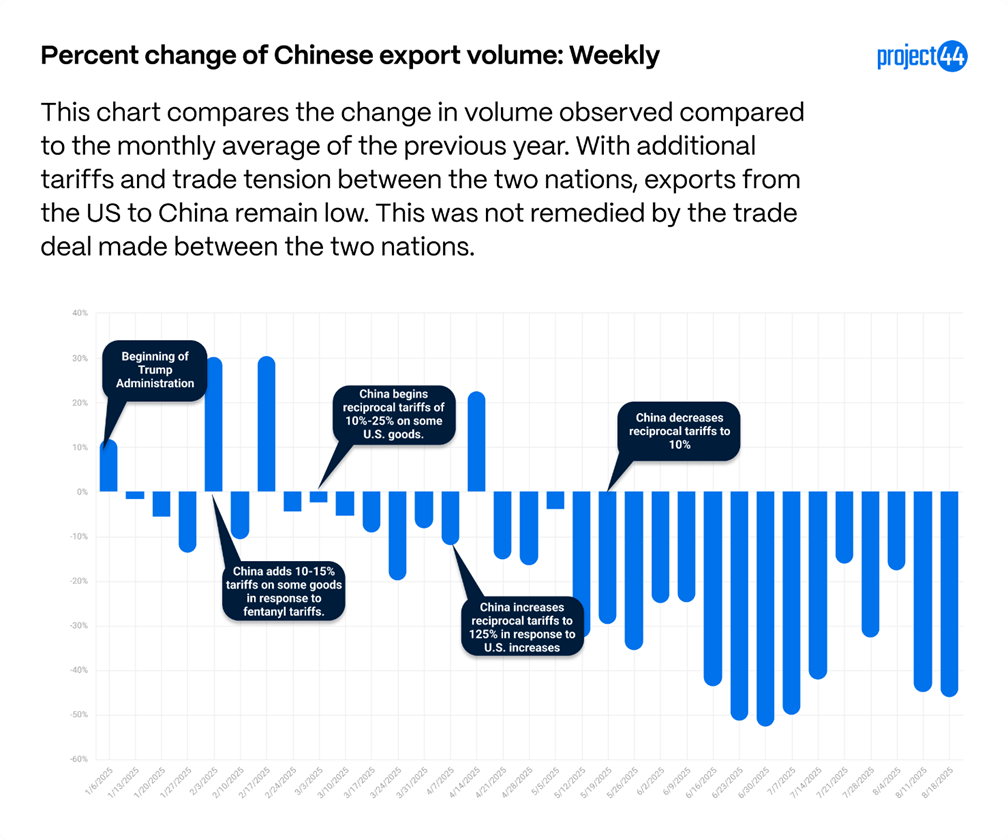
China’s reciprocal tariffs on U.S. goods have had a pronounced impact on exports from the U.S. to China. Even after Beijing lowered some rates, export volumes have continued to weaken, with recent weekly figures showing sustained double-digit percentage declines compared to 2024. This is particularly concerning given that China remains the third-largest importer of U.S. goods by volume.
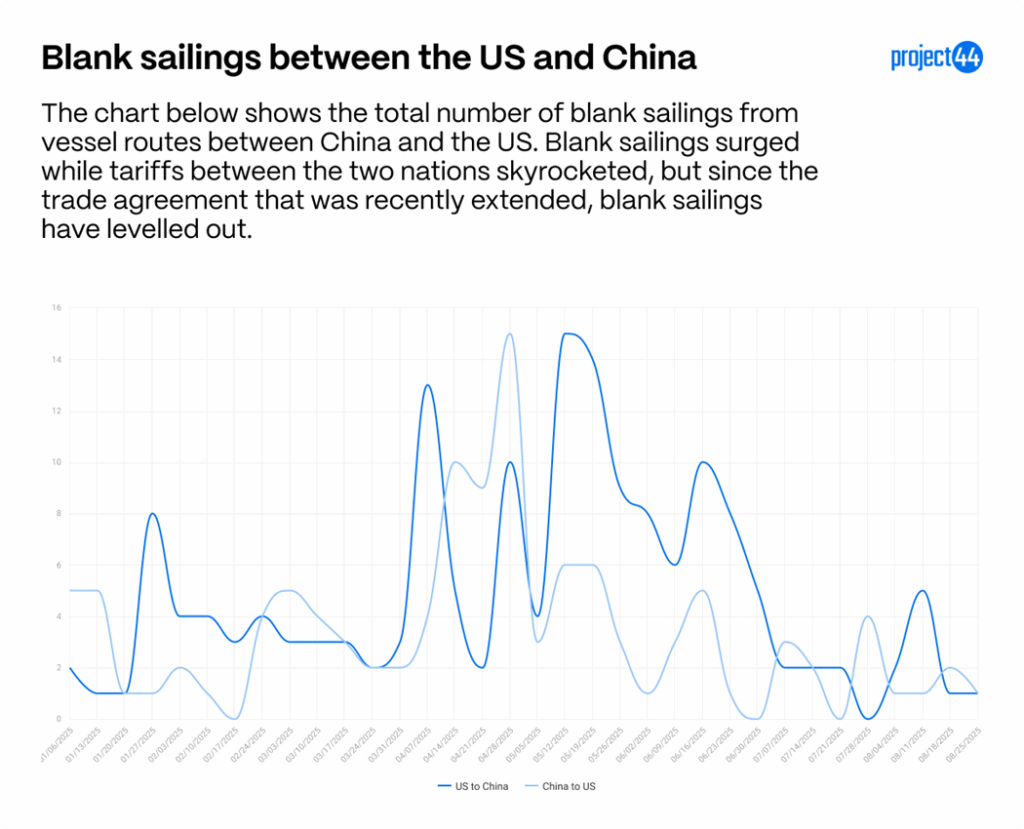
Blank sailings data reinforces the picture of a market that has calmed—at least for now. Both eastbound (U.S. to China) and westbound (China to U.S.) blank sailings spiked during periods of tariff escalation, reflecting capacity adjustments to falling demand. However, once the trade deal between the two countries was extended, blank sailing rates dropped sharply and have remained comparatively steady. This does indicate a steadier demand for capacity along these routes.
What to watch: While current trends point to stabilization, the U.S.–China trade lane remains vulnerable to political and economic shifts. Any breakdown in negotiations, re-escalation of tariffs, or macroeconomic shock could quickly reverse the recent gains in volume and trigger another spike in blank sailings. Shippers should remain prepared for renewed volatility and consider diversifying routing and sourcing strategies to mitigate potential disruptions.
Tariffs leave U.S. imports and exports proportionally unchanged
While tariffs have reshaped certain trade lanes at a micro level, the broader proportions of U.S. imports and exports by country have seen only modest changes in 2025. This suggests that, despite political and economic headwinds, most U.S. companies have not significantly restructured their sourcing or customer base.
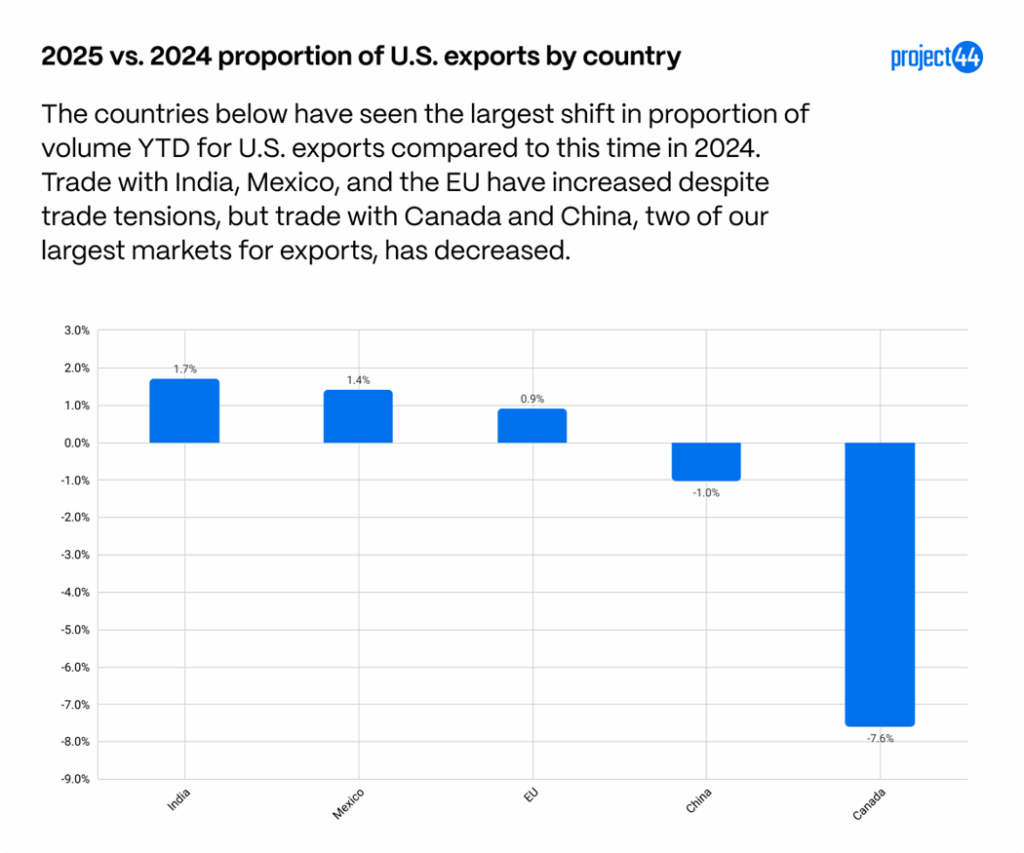
On the export side, Canada— one of America’s largest export partners—stood out for a steep 7.6% year-to-date drop in its share of U.S. exports. Political and economic tensions are high between Canada and the United States, which has resulted in “Buy Canadian” movements and impacted Canadian demand of some U.S. goods like alcohol, which could be a contributing factor to the lower rate the Canada is ordering U.S. goods. China is also seeing one of the largest decreases YTD at a 1% decrease. Meanwhile, India (+1.7%) and Mexico (+1.4%) have posted the largest proportional export gains, likely reflecting multi-year growth trends and ongoing diversification of U.S. export markets.
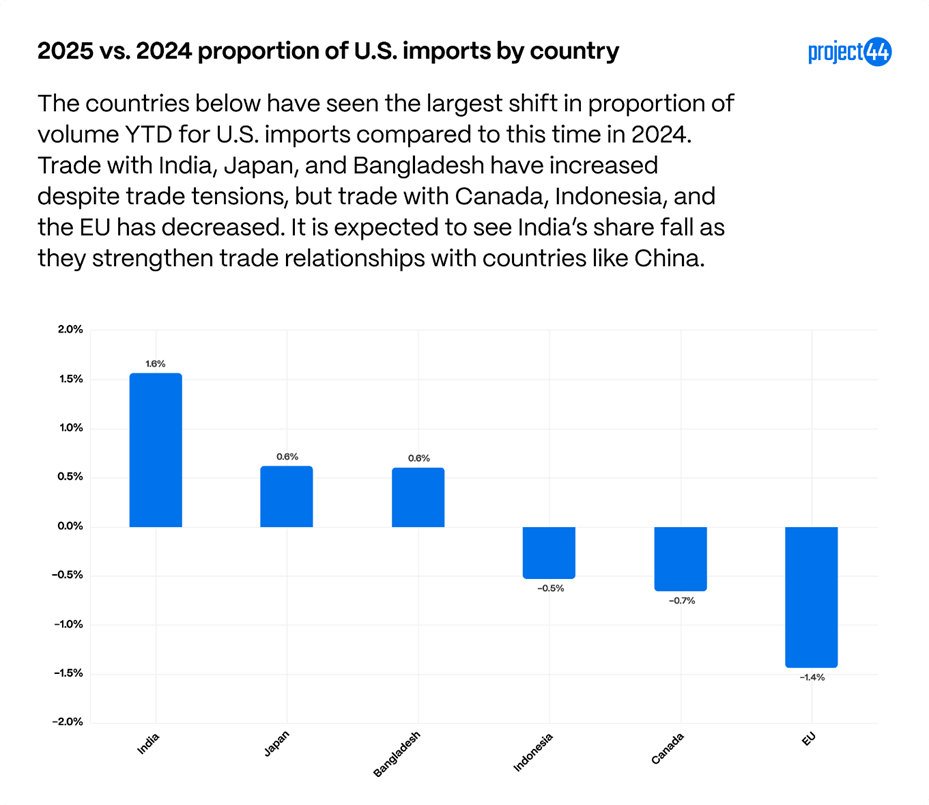
For imports, changes have been similarly modest. India has recorded the biggest increase in share (+1.6%), followed by Bangladesh and Japan (+0.6%), while the EU (-1.4%), Canada (-0.7%), and Indonesia (-0.5%), have all seen small declines. The increased shifts appear to be part of a broader trend toward supply chain diversification away from China, rather than a direct reaction to the 2025 tariff environment. However, trade tensions with India continue to rise and could result in a reduced amount of imports over a longer period of time.
Notably, China’s share of U.S. imports remains essentially unchanged compared to 2024. While weekly data shows some volatility—especially around tariff hikes and subsequent reductions—the overall annual share has returned to last year’s baseline following an early-year surge from front-loaded orders.
Taken together, the data suggests that while tariffs and trade tensions are influencing short-term order timing and lane-level performance, they have yet to spark major structural shifts in U.S. trade patterns. Imports remain stable, with additional costs likely absorbed by vendors, importers, or end consumers, while exports show more signs of fluctuation as certain partners reassess their purchasing of U.S. goods.urchasing of U.S. goods.
Strategy shifts in the wake of uncertainty
Short-term, there was a push to pull forward inventory earlier this year to mitigate the impact of potential tariffs, which were a key element of Trump’s campaign. This is apparent in the imports seen from China, where volumes were up significantly compared to 2024. There was also a smaller push for inventory. However, overall there seems to be a wait-and-see approach and the overall import patterns of the U.S. remain widely unchanged.
Given the unpredictability of trade policies, companies are hesitant to make substantial investments in new manufacturing facilities or overhaul complex supply chains. The shifting landscape underscores the uncertainty facing businesses, particularly with ongoing legal challenges currently going through the court systems around the legality of the liberation day tariffs. This is also the Trump Administration’s final term and it is unclear that a future administration would keep the current tariffs in place, meaning that 2029 could mark the end of these new tariffs.
Appendix
These charts are made to serve as a baseline to fully understand the scope of tariffs and shifting trade dynamics. According to data from the millions of shipments managed annually by project44, the United States primarily imports goods from the following top countries by volume:
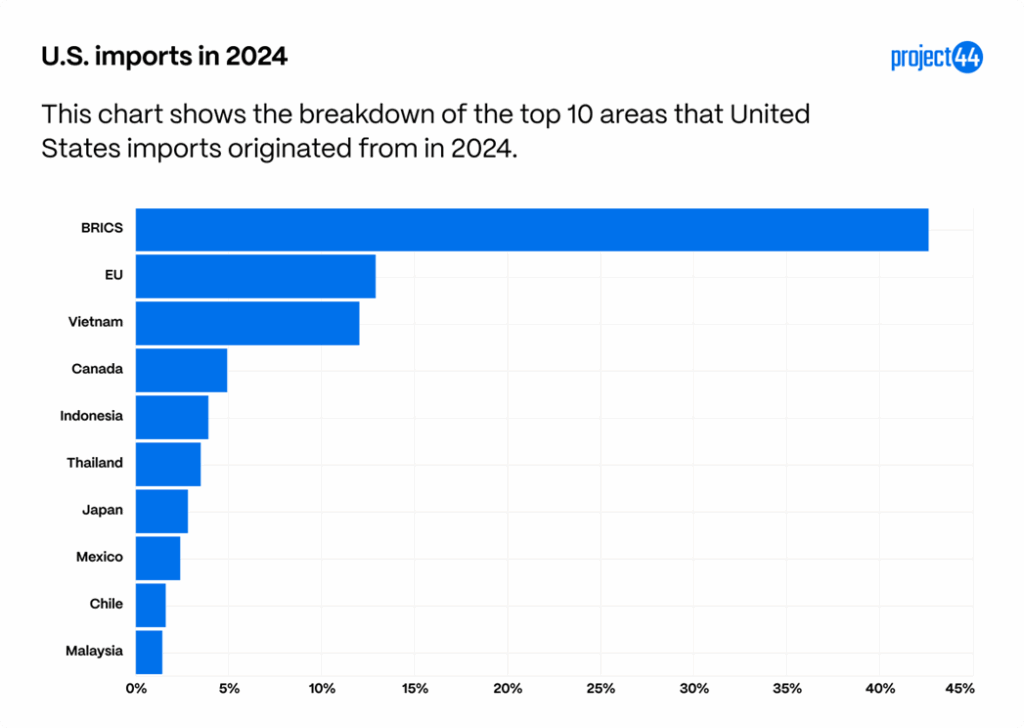
China, which is included in the BRICS category, is our largest provider of imports, followed by the EU and Vietnam. These three regions make up more than 50% of the imports tracked by project44 in 2024.
Below are the countries that see the most American exports based off project44 data.
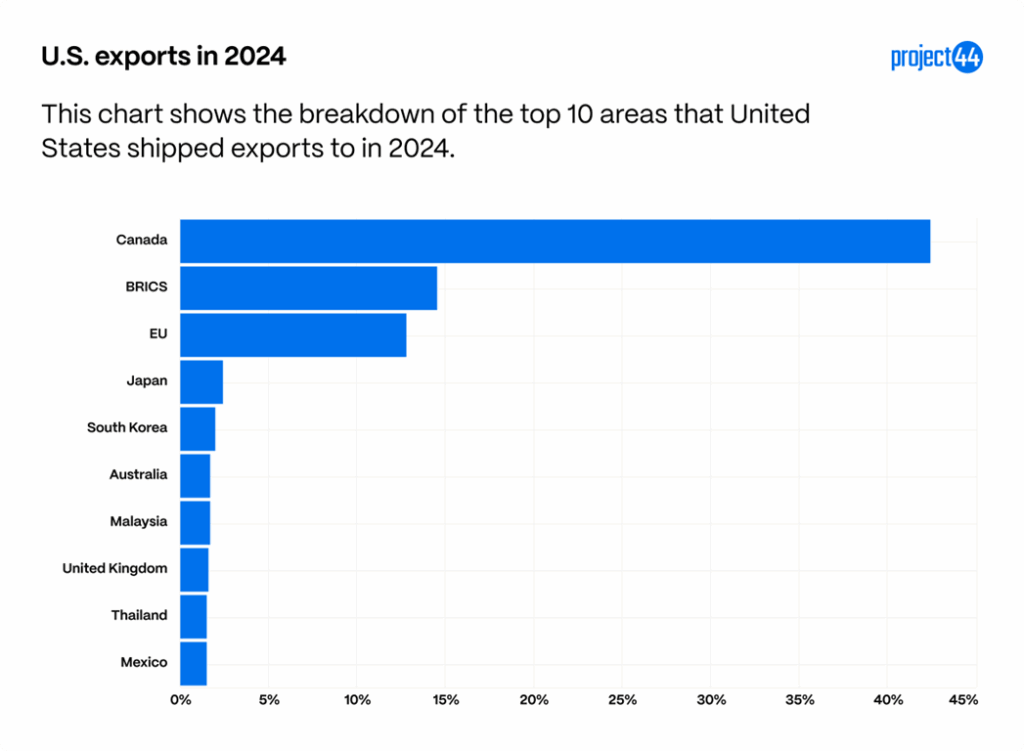
With China separated from the BRICS nations, they receive 8.5% of exports, meaning Canada, China, and the EU make up more than half of the shipments exported from the United States in 2024.
These charts are made to serve as a baseline to fully understand the scope of tariffs and shifting trade dynamics.
Summary
Overall, the 2025 trade landscape reflects a mix of short-term volatility and longer-term stability. While sweeping “Liberation Day” tariffs and reciprocal measures from key partners have driven lane-specific disruptions—seen in early-year order surges, declines in exports to major markets like Canada and China, and spikes in blank sailings—these impacts have largely been absorbed without triggering major structural changes to U.S. trade patterns. Import shares by country remain relatively stable, with modest gains for India and Bangladesh pointing to ongoing diversification trends, while exports have shown more fluctuation as global partners reassess demand for U.S. goods. As tariff rates stabilize and trade agreements are extended, current patterns suggest a cautious equilibrium—yet the potential for renewed volatility remains if geopolitical or policy conditions shift. Based on this, it appears that the largest impact tariffs will have short-term is the price of goods rather than global trade routes.